The <strong>National</strong> Railroad Passenger Corporation, known as Amtrak, began operation in 1971. Though Amtrak revenue passenger-miles have grown at an average annual rate of 3.5% from 1971 to 2001, they showed a small decline in annual percentage change from 1991 to 2001. Year Table 9.12 Summary Statistics for the <strong>National</strong> Railroad Passenger Corporation (Amtrak), 1971–2001 Number of locomotives in service Number of passenger cars Train-miles (thousands) Car-miles (thousands) Revenue passengermiles (millions) Average trip length (miles) a Data are not available. b Energy use for 1994 on is not directly comparable to earlier years. Some commuter rail <strong>energy</strong> use may have been inadvertently included in earlier years. TRANSPORTATION ENERGY DATA BOOK: EDITION <strong>23</strong>—2003 Energy intensity (Btu per revenue passenger-mile) Energy use (trillion Btu) 1971 a 1,165 16,537 140,147 1,993 188 a a 1975 355 1,913 30,166 253,898 3,753 224 3,677 13.8 1980 448 2,128 29,487 <strong>23</strong>5,<strong>23</strong>5 4,503 217 3,176 14.3 1981 398 1,830 30,380 222,753 4,397 226 2,979 13.1 1982 396 1,929 28,833 217,385 3,993 220 3,156 12.6 1983 388 1,880 28,805 2<strong>23</strong>,509 4,227 2<strong>23</strong> 2,957 12.5 1984 387 1,844 29,133 <strong>23</strong>4,557 4,427 227 3,027 13.4 1985 382 1,818 30,038 250,642 4,785 <strong>23</strong>8 2,800 13.4 1986 369 1,793 28,604 249,665 5,011 249 2,574 12.9 1987 381 1,850 29,515 261,054 5,361 259 2,537 13.6 1988 391 1,845 30,221 277,774 5,686 265 2,462 14.0 1989 312 1,742 31,000 285,255 5,859 274 2,731 16.0 1990 318 1,863 33,000 300,996 6,057 273 2,609 15.8 1991 316 1,786 34,000 312,484 6,273 285 2,503 15.7 1992 336 1,796 34,000 307,282 6,091 286 2,610 15.9 1993 360 1,853 34,936 302,739 6,199 280 2,646 16.4 1994 411 1,874 34,940 305,600 5,869 276 2,357 13.8b 1995 422 1,907 31,579 282,579 5,401 266 2,590 14.0 1996 348 1,501 30,542 277,750 5,066 257 2,792 14.1 1997 292 1,572 32,000 287,760 5,166 255 2,918 15.1 1998 362 1,347 32,926 315,8<strong>23</strong> 5,325 251 2,900 15.4 1999 385 1,285 34,080 349,337 5,289 245 3,062 16.2 2000 385 1,891 35,404 371,215 5,574 243 3,356 18.7 2001 401 2,084 36,512 377,705 5,571 <strong>23</strong>8 4,137 <strong>23</strong>.0 Average annual percentage change 1971–2001 a 2.0% 2.7% 3.4% 3.5% 0.8% a a 1991–2001 2.4% 1.6% 0.7% 1.9% -1.2% -1.8% 5.2% 3.9% Source: 1971–83- Association of American Railroads, Economics and Finance Department, Statistics of Class I Railroads, Washington, DC, and annual. 1984–88- Association of American Railroads, Railroad Facts, 1988 Edition, Washington, DC, December 1989, p. 61, and annual. 1989–93- Personal communication with the Corporate Accounting Office of Amtrak, Washington, D.C. 1994–2001 - Number of locomotives in service, number of passenger cars, train-miles, car-miles, revenue passenger-miles, and average trip length - Association of American Railroads, Railroad Facts, 2002 Edition, Washington, DC, 2002, p. 77. Energy use - Personal communication with the Amtrak, Washington, DC. (Additional resources: www.amtrak.com, www.aar.org) 9–13
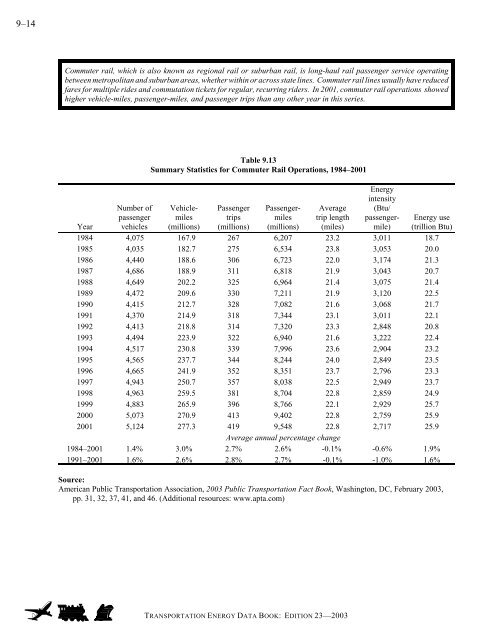
9–14 Commuter rail, which is also known as regional rail or suburban rail, is long-haul rail passenger service operating between metropolitan and suburban areas, whether within or across state lines. Commuter rail lines usually have reduced fares for multiple rides and commutation tickets for regular, recurring riders. In 2001, commuter rail operations showed higher vehicle-miles, passenger-miles, and passenger trips than any other year in this series. Year Number of passenger vehicles Table 9.13 Summary Statistics for Commuter Rail Operations, 1984–2001 Vehiclemiles (millions) Passenger trips (millions) Passengermiles (millions) Average trip length (miles) TRANSPORTATION ENERGY DATA BOOK: EDITION <strong>23</strong>—2003 Energy intensity (Btu/ passengermile) Energy use (trillion Btu) 1984 4,075 167.9 267 6,207 <strong>23</strong>.2 3,011 18.7 1985 4,035 182.7 275 6,534 <strong>23</strong>.8 3,053 20.0 1986 4,440 188.6 306 6,7<strong>23</strong> 22.0 3,174 21.3 1987 4,686 188.9 311 6,818 21.9 3,043 20.7 1988 4,649 202.2 325 6,964 21.4 3,075 21.4 1989 4,472 209.6 330 7,211 21.9 3,120 22.5 1990 4,415 212.7 328 7,082 21.6 3,068 21.7 1991 4,370 214.9 318 7,344 <strong>23</strong>.1 3,011 22.1 1992 4,413 218.8 314 7,320 <strong>23</strong>.3 2,848 20.8 1993 4,494 2<strong>23</strong>.9 322 6,940 21.6 3,222 22.4 1994 4,517 <strong>23</strong>0.8 339 7,996 <strong>23</strong>.6 2,904 <strong>23</strong>.2 1995 4,565 <strong>23</strong>7.7 344 8,244 24.0 2,849 <strong>23</strong>.5 1996 4,665 241.9 352 8,351 <strong>23</strong>.7 2,796 <strong>23</strong>.3 1997 4,943 250.7 357 8,038 22.5 2,949 <strong>23</strong>.7 1998 4,963 259.5 381 8,704 22.8 2,859 24.9 1999 4,883 265.9 396 8,766 22.1 2,929 25.7 2000 5,073 270.9 413 9,402 22.8 2,759 25.9 2001 5,124 277.3 419 9,548 22.8 2,717 25.9 Average annual percentage change 1984–2001 1.4% 3.0% 2.7% 2.6% -0.1% -0.6% 1.9% 1991–2001 1.6% 2.6% 2.8% 2.7% -0.1% -1.0% 1.6% Source: American Public <strong>Transportation</strong> Association, 2003 Public <strong>Transportation</strong> Fact Book, Washington, DC, February 2003, pp. 31, 32, 37, 41, and 46. (Additional resources: www.apta.com)
- Page 1 and 2:
Center for Transportation Analysis
- Page 3:
Users of the Transportation Energy
- Page 6 and 7:
vi TABLE OF CONTENTS (Continued) Ta
- Page 8 and 9:
viii TABLE OF CONTENTS (Continued)
- Page 10 and 11:
x TABLE OF CONTENTS (Continued) Tab
- Page 12 and 13:
xii TABLE OF CONTENTS (Continued) T
- Page 14 and 15:
xiv TABLE OF CONTENTS (Continued) T
- Page 16 and 17:
xvi TRANSPORTATION ENERGY DATA BOOK
- Page 18 and 19:
xviii TRANSPORTATION ENERGY DATA BO
- Page 20 and 21:
xx TRANSPORTATION ENERGY DATA BOOK:
- Page 22 and 23:
xxii TRANSPORTATION ENERGY DATA BOO
- Page 24 and 25:
xxiv TRANSPORTATION ENERGY DATA BOO
- Page 26 and 27:
1-2 Although the world has consumed
- Page 28 and 29:
1-4 This table shows petroleum prod
- Page 30 and 31:
1-6 Figure 1.2. World Oil Reserves,
- Page 32 and 33:
1-8 Total OECD government-owned pet
- Page 34 and 35:
1-10 The share of petroleum importe
- Page 36 and 37:
1-12 Estimates of military expendit
- Page 38 and 39:
TRANSPORTATION ENERGY DATA BOOK: ED
- Page 40 and 41:
1-16 Most of the petroleum imported
- Page 42 and 43:
1-18 Millions of Barrels per Day Th
- Page 44 and 45:
1-20 Pipelines accounted for two-th
- Page 46 and 47:
2-2 Petroleum accounted for 40% of
- Page 48 and 49:
2-4 The Energy Information Administ
- Page 50 and 51:
2-6 As data about alternative fuel
- Page 52 and 53:
2-8 The highway sector is by far th
- Page 54 and 55:
2-10 The use of diesel for off-high
- Page 56 and 57:
2-12 Nearly all of the fuel ethanol
- Page 58 and 59:
2-14 Great care should be taken whe
- Page 60 and 61:
2-16 Figure 2.2. Energy Intensities
- Page 62 and 63:
2-18 Great care should be taken whe
- Page 64 and 65:
2-20 Nearly all of the fuel ethanol
- Page 66 and 67:
2-22 Great care should be taken whe
- Page 68 and 69:
2-24 Figure 2.2. Energy Intensities
- Page 70 and 71:
2-26 Great care should be taken whe
- Page 72 and 73:
Source Chapter 3 All Highway Vehicl
- Page 74 and 75:
TRANSPORTATION ENERGY DATA BOOK: ED
- Page 76 and 77:
TRANSPORTATION ENERGY DATA BOOK: ED
- Page 78 and 79:
The data on automobile and light tr
- Page 80 and 81:
TRANSPORTATION ENERGY DATA BOOK: ED
- Page 82 and 83:
The average age of automobiles was
- Page 84 and 85:
Using current registration data and
- Page 86 and 87:
Using current registration data and
- Page 88 and 89:
Using current registration data and
- Page 90 and 91:
Chapter 4 Light Vehicles and Charac
- Page 92 and 93:
The Federal Highway Administration
- Page 94 and 95:
Over one-quarter of autos sold in 2
- Page 96 and 97:
The sales-weighted fuel economy of
- Page 98 and 99:
Back in 1976 only 20% of new light
- Page 100 and 101:
The compact, midsize, and large aut
- Page 102 and 103:
The large car size class is the onl
- Page 104 and 105:
The sales-weighted wheelbase of new
- Page 106 and 107:
The number of franchised dealership
- Page 108 and 109:
The Corporate Average Fuel Economy
- Page 110 and 111:
Manufacturers of autos and light tr
- Page 112 and 113:
Consumers continue to demand gas gu
- Page 114 and 115:
Vehicle Table 4.23 Vehicle Specific
- Page 116 and 117:
Source: See Table 4.23. Figure 4.2.
- Page 118 and 119:
The Environmental Protection Agency
- Page 120 and 121:
The US06 driving cycle was develope
- Page 122 and 123:
When comparing data between countri
- Page 124 and 125:
In 2001, the fatality rate for vehi
- Page 126 and 127:
For fatal crashes in 2001, sport-ut
- Page 128 and 129:
Source Chapter 5 Heavy Vehicles and
- Page 130 and 131:
Combination trucks include all truc
- Page 132 and 133:
Vehicle Inventory and Use Survey Th
- Page 134 and 135:
As expected, most light trucks trav
- Page 136 and 137:
In 1997 nearly 60% of all truck fle
- Page 138 and 139:
Commodity Flow Survey The Commodity
- Page 140 and 141:
Industries covered by the 1997 Comm
- Page 142 and 143:
There are currently not many source
- Page 144 and 145:
6-2 Alternative Fuels The U.S. Depa
- Page 146 and 147:
6-4 Nearly 90% of private alternati
- Page 148 and 149:
6-6 This list includes public and p
- Page 150 and 151: 6-8 The Honda Insight, Civic Hybrid
- Page 152 and 153: 6-10 The relative efficiencies of s
- Page 154 and 155: 6-12 In 1999 (the latest year for w
- Page 156 and 157: 6-14 Table 6.10 Properties of Conve
- Page 158 and 159: Source Chapter 7 Fleet Vehicles and
- Page 160 and 161: According to these estimates of lig
- Page 162 and 163: These data, which apply to domestic
- Page 164 and 165: Table 7.6 Federal Fleet Vehicle Acq
- Page 166 and 167: Source Chapter 8 Household Vehicles
- Page 168 and 169: Vehicle-miles per capita have nearl
- Page 170 and 171: Household vehicle ownership shows a
- Page 172 and 173: Due to methodology improvements in
- Page 174 and 175: In 2001 vehicle-miles traveled (vmt
- Page 176 and 177: The average vehicle occupancy, calc
- Page 178 and 179: The average annual miles per vehicl
- Page 180 and 181: According to the U.S. Census data,
- Page 182 and 183: Sales of bicycles with wheel sizes
- Page 184 and 185: In 2001, 5% of walk trips and 8% of
- Page 186 and 187: Personal-use vehicles are by far th
- Page 188 and 189: Source Chapter 9 Nonhighway Modes S
- Page 190 and 191: These data include all internationa
- Page 192 and 193: In the early seventies, domestic wa
- Page 194 and 195: TRANSPORTATION ENERGY DATA BOOK: ED
- Page 196 and 197: The Interstate Commerce Commission
- Page 198 and 199: The “other” category, which con
- Page 202 and 203: This table on transit rail operatio
- Page 204 and 205: TRANSPORTATION ENERGY DATA BOOK: ED
- Page 206 and 207: TRANSPORTATION ENERGY DATA BOOK: ED
- Page 208 and 209: 10-6 Though the cost of crude oil c
- Page 210 and 211: 10-8 The fuel prices shown here are
- Page 212 and 213: 10-10 Table 10.7 State Taxes on Mot
- Page 214 and 215: 10-12 At the end of 2001, only four
- Page 216 and 217: 10-14 In current dollars, import ca
- Page 218 and 219: TRANSPORTATION ENERGY DATA BOOK: ED
- Page 220 and 221: 10-18 Knowing the number of employe
- Page 222 and 223: 11-2 The U. S. accounted for 23.0%
- Page 224 and 225: 11-4 Carbon dioxide emissions in 20
- Page 226 and 227: 11-6 Most U.S. transportation secto
- Page 228 and 229: Source Chapter 12 Criteria Air Poll
- Page 230 and 231: The transportation sector accounted
- Page 232 and 233: The transportation sector accounted
- Page 234 and 235: The transportation sector accounted
- Page 236 and 237: The transportation sector accounted
- Page 238 and 239: The transportation sector accounted
- Page 240 and 241: The Greenhouse Gases, Regulated Emi
- Page 242 and 243: TRANSPORTATION ENERGY DATA BOOK: ED
- Page 244 and 245: TRANSPORTATION ENERGY DATA BOOK: ED
- Page 246 and 247: TRANSPORTATION ENERGY DATA BOOK: ED
- Page 248 and 249: TRANSPORTATION ENERGY DATA BOOK: ED
- Page 250 and 251:
TRANSPORTATION ENERGY DATA BOOK: ED
- Page 252 and 253:
APPENDIX A SOURCES & METHODOLOGIES
- Page 254 and 255:
Highway energy use Automobiles Ener
- Page 256 and 257:
Trucks Eno Transportation Foundatio
- Page 258 and 259:
Medium/Heavy Trucks: DOT, FHWA, Hig
- Page 260 and 261:
Nonhighway energy use Air General A
- Page 262 and 263:
Water Freight: Total - DOE, EIA, Fu
- Page 264 and 265:
Pipeline The sum of natural gas, cr
- Page 266 and 267:
Rail Freight: AAR, Railroad Facts,
- Page 268 and 269:
Transit - APTA, 2003 Transit Fact B
- Page 270 and 271:
Automobiles Passenger Travel and En
- Page 272 and 273:
Intercity School Air Passenger-mile
- Page 274 and 275:
Automobiles Highway Passenger Mode
- Page 276 and 277:
Air Certificated air carriers Nonhi
- Page 278 and 279:
Truck Freight Mode Energy Intensiti
- Page 280 and 281:
Sales - Domestic and import totals
- Page 282 and 283:
Trucks less than 8,500 lbs (Classes
- Page 284 and 285:
Light Fleet Vehicle Population Flee
- Page 286 and 287:
Light trucks Business Bobit Publish
- Page 288 and 289:
B-2 Pounds (lb) Table B.1 Hydrogen
- Page 290 and 291:
B-4 Table B.4 Fuel Equivalents 1 mi
- Page 292 and 293:
B-6 Table B.7 Distance and Velocity
- Page 294 and 295:
B-8 FROM Horsepower Kilowatts Table
- Page 296 and 297:
B-10 Table B.12 Fuel Efficiency Con
- Page 298 and 299:
B-12 Table B.14 Metric Units and Ab
- Page 300 and 301:
TRANSPORTATION ENERGY DATA BOOK: ED
- Page 302 and 303:
APPENDIX C MAPS TRANSPORTATION ENER
- Page 304 and 305:
Figure C1. Census Divisions and Reg
- Page 306 and 307:
Source: See Table C.2. Figure C.2.
- Page 308 and 309:
G-2 Alcohol - The family name of a
- Page 310 and 311:
G-4 Combination trucks - Consist of
- Page 312 and 313:
G-6 Energy capacity - Measured in k
- Page 314 and 315:
G-8 person living alone, two or mor
- Page 316 and 317:
G-10 M100 - 100% methanol. Medium t
- Page 318 and 319:
G-12 Poland, Portugal, Spain, Swede
- Page 320 and 321:
G-14 Proved Reserves of Crude Oil -
- Page 322 and 323:
G-16 Test weight - The weight setti
- Page 324 and 325:
TITLE INDEX TRANSPORTATION ENERGY D
- Page 326 and 327:
Automobiles (continued) Average Age
- Page 328 and 329:
(Category LDT3) ...................
- Page 330 and 331:
Countries Petroleum Stocks of OECD
- Page 332 and 333:
Light Truck Corporate Average Fuel
- Page 334 and 335:
Heavy Trucks.......................
- Page 336 and 337:
FY Federal Fleet Vehicle Acquisitio
- Page 338 and 339:
Incentives State Ethanol Incentives
- Page 340 and 341:
Mile Automobile Operating Cost per
- Page 342 and 343:
Oil World Crude Oil Production, 196
- Page 344 and 345:
Powered Federal Exhaust Emission Ce
- Page 346 and 347:
New Retail Sales of Trucks 10,000 p
- Page 348 and 349:
Standards Automobile Corporate Aver
- Page 350 and 351:
Time Average Length of Time Busines
- Page 352 and 353:
United States Petroleum Production,
- Page 354:
Workers Workers by Commute Time, 19