These <strong>data</strong> include all international and domestic certificated route air carrier statistics; therefore, the <strong>data</strong> are different than those in Chapter 2. All of the air carrier statistics declined in the year 2001, most likely due to the events of September 11, 2001, which caused air travel to decline drastically in the last quarter of the year. Table 9.2 Summary Statistics for U.S. Domestic and International Certificated Route Air Carriers (Combined Totals), 1970–2001 a Revenue Average aircraft-miles passenger trip Year (millions) lengthb Revenue passenger-miles (miles) (millions) 1970 2,383 678 131,719 f Available seat-miles (millions) Available seats per aircraft c Passenger load factor (percentage) d 264,904 f 111 49.7% f aData are for all U.S. air carriers reporting on Form 41. bScheduled services of domestic operations only. The average passenger trip length for international operations is more than three and a half times longer than for domestic operations. cAvailable seats per aircraft is calculated as the ratio of available seat-miles to revenue aircraft-miles. dPassenger load factor is calculated as the ratio of revenue passenger-miles to available seat-miles for scheduled and nonscheduled services. eEnergy use includes fuel purchased abroad for international flights. fScheduled services only. TRANSPORTATION ENERGY DATA BOOK: EDITION <strong>23</strong>—2003 Revenue cargo ton-miles (millions) Energy use (trillion Btu) e 4,994 1,363.4 1975 2,241 698 173,324 315,8<strong>23</strong> 135 54.9% 5,944 1,283.4 1980 2,924 736 267,722 448,479 148 59.7% 7,515 1,386.0 1985 3,462 758 351,073 565,677 163 62.1% 9,048 1,701.4 1986 3,873 767 378,9<strong>23</strong> 6<strong>23</strong>,073 161 60.8% 10,987 1,847.1 1987 4,182 779 417,830 670,871 160 62.3% 13,130 1,945.9 1988 4,355 786 437,649 696,337 160 62.9% 14,633 2,049.4 1989 4,442 792 447,480 703,888 158 63.6% 16,347 2,087.4 1990 4,724 803 472,<strong>23</strong>6 753,211 159 62.7% 16,411 2,213.0 1991 4,661 806 463,296 738,030 158 62.8% 16,149 2,085.2 1992 4,899 806 493,715 772,869 158 63.9% 17,306 2,144.2 1993 5,118 799 505,996 793,959 155 63.7% 19,083 2,169.7 1994 5,360 787 537,506 809,240 151 66.4% 21,773 2,266.2 1995 5,627 791 558,757 845,012 150 66.1% <strong>23</strong>,375 2,338.6 1996 5,855 802 596,164 859,720 147 69.3% 24,892 2,409.1 1997 6,025 814 619,969 880,607 146 70.4% 27,610 2,514.2 1998 6,227 812 635,517 899,851 145 70.6% 28,102 2,573.4 1999 6,558 824 668,626 942,311 144 71.0% 28,984 2,653.1 2000 6,944 833 708,419 980,379 141 72.3% 30,863 2,743.1 2001 6,807 842 664,841 950,530 140 69.9% 27,882 2,599.4 Average annual percentage change 1970–2001 3.4% 0.7% 5.4% 4.2% 0.8% 5.7% 2.1% 1991–2001 3.9% 0.4% 3.7% 2.6% -1.2% 5.6% 2.2% Source: U.S. Department of <strong>Transportation</strong>, Bureau of <strong>Transportation</strong> Statistics, Air Carrier Traffic Statistics Monthly, December 2001/2000, Washington, DC, pp. 1–2, and annual. 1970–76 Energy Use - Department of <strong>Transportation</strong>, Civil Aeronautics Board, Fuel Cost and Consumption, Washington, DC, 1981, and annual. 1977–2001 Energy Use - Department of <strong>Transportation</strong>, Bureau of <strong>Transportation</strong> Statistics, "Fuel Cost and Consumption Table," Washington, DC. (Additional resources: www.bts.gov, www.faa.gov) 9–3
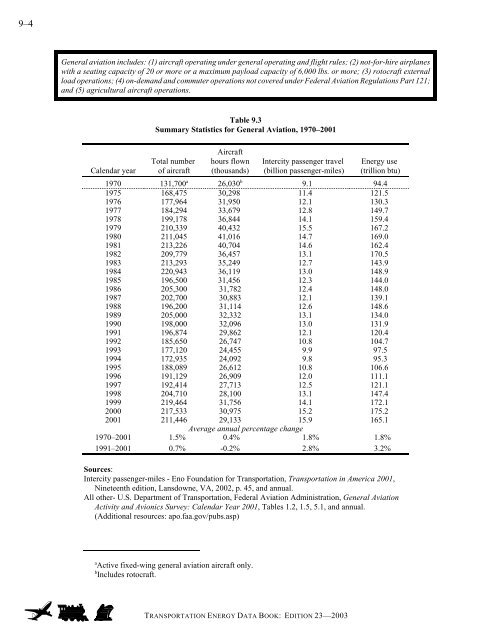
9–4 General aviation includes: (1) aircraft operating under general operating and flight rules; (2) not-for-hire airplanes with a seating capacity of 20 or more or a maximum payload capacity of 6,000 lbs. or more; (3) rotocraft external load operations; (4) on-demand and commuter operations not covered under Federal Aviation Regulations Part 121; and (5) agricultural aircraft operations. Calendar year Table 9.3 Summary Statistics for General Aviation, 1970–2001 Total number of aircraft Aircraft hours flown (thousands) a Active fixed-wing general aviation aircraft only. b Includes rotocraft. Intercity passenger travel (billion passenger-miles) TRANSPORTATION ENERGY DATA BOOK: EDITION <strong>23</strong>—2003 Energy use (trillion btu) 1970 131,700 a 26,030 b 9.1 94.4 1975 168,475 30,298 11.4 121.5 1976 177,964 31,950 12.1 130.3 1977 184,294 33,679 12.8 149.7 1978 199,178 36,844 14.1 159.4 1979 210,339 40,432 15.5 167.2 1980 211,045 41,016 14.7 169.0 1981 213,226 40,704 14.6 162.4 1982 209,779 36,457 13.1 170.5 1983 213,293 35,249 12.7 143.9 1984 220,943 36,119 13.0 148.9 1985 196,500 31,456 12.3 144.0 1986 205,300 31,782 12.4 148.0 1987 202,700 30,883 12.1 139.1 1988 196,200 31,114 12.6 148.6 1989 205,000 32,332 13.1 134.0 1990 198,000 32,096 13.0 131.9 1991 196,874 29,862 12.1 120.4 1992 185,650 26,747 10.8 104.7 1993 177,120 24,455 9.9 97.5 1994 172,935 24,092 9.8 95.3 1995 188,089 26,612 10.8 106.6 1996 191,129 26,909 12.0 111.1 1997 192,414 27,713 12.5 121.1 1998 204,710 28,100 13.1 147.4 1999 219,464 31,756 14.1 172.1 2000 217,533 30,975 15.2 175.2 2001 211,446 29,133 15.9 165.1 Average annual percentage change 1970–2001 1.5% 0.4% 1.8% 1.8% 1991–2001 0.7% -0.2% 2.8% 3.2% Sources: Intercity passenger-miles - Eno Foundation for <strong>Transportation</strong>, <strong>Transportation</strong> in America 2001, Nineteenth <strong>edition</strong>, Lansdowne, VA, 2002, p. 45, and annual. All other- U.S. Department of <strong>Transportation</strong>, Federal Aviation Administration, General Aviation Activity and Avionics Survey: Calendar Year 2001, Tables 1.2, 1.5, 5.1, and annual. (Additional resources: apo.faa.gov/pubs.asp)
- Page 1 and 2:
Center for Transportation Analysis
- Page 3:
Users of the Transportation Energy
- Page 6 and 7:
vi TABLE OF CONTENTS (Continued) Ta
- Page 8 and 9:
viii TABLE OF CONTENTS (Continued)
- Page 10 and 11:
x TABLE OF CONTENTS (Continued) Tab
- Page 12 and 13:
xii TABLE OF CONTENTS (Continued) T
- Page 14 and 15:
xiv TABLE OF CONTENTS (Continued) T
- Page 16 and 17:
xvi TRANSPORTATION ENERGY DATA BOOK
- Page 18 and 19:
xviii TRANSPORTATION ENERGY DATA BO
- Page 20 and 21:
xx TRANSPORTATION ENERGY DATA BOOK:
- Page 22 and 23:
xxii TRANSPORTATION ENERGY DATA BOO
- Page 24 and 25:
xxiv TRANSPORTATION ENERGY DATA BOO
- Page 26 and 27:
1-2 Although the world has consumed
- Page 28 and 29:
1-4 This table shows petroleum prod
- Page 30 and 31:
1-6 Figure 1.2. World Oil Reserves,
- Page 32 and 33:
1-8 Total OECD government-owned pet
- Page 34 and 35:
1-10 The share of petroleum importe
- Page 36 and 37:
1-12 Estimates of military expendit
- Page 38 and 39:
TRANSPORTATION ENERGY DATA BOOK: ED
- Page 40 and 41:
1-16 Most of the petroleum imported
- Page 42 and 43:
1-18 Millions of Barrels per Day Th
- Page 44 and 45:
1-20 Pipelines accounted for two-th
- Page 46 and 47:
2-2 Petroleum accounted for 40% of
- Page 48 and 49:
2-4 The Energy Information Administ
- Page 50 and 51:
2-6 As data about alternative fuel
- Page 52 and 53:
2-8 The highway sector is by far th
- Page 54 and 55:
2-10 The use of diesel for off-high
- Page 56 and 57:
2-12 Nearly all of the fuel ethanol
- Page 58 and 59:
2-14 Great care should be taken whe
- Page 60 and 61:
2-16 Figure 2.2. Energy Intensities
- Page 62 and 63:
2-18 Great care should be taken whe
- Page 64 and 65:
2-20 Nearly all of the fuel ethanol
- Page 66 and 67:
2-22 Great care should be taken whe
- Page 68 and 69:
2-24 Figure 2.2. Energy Intensities
- Page 70 and 71:
2-26 Great care should be taken whe
- Page 72 and 73:
Source Chapter 3 All Highway Vehicl
- Page 74 and 75:
TRANSPORTATION ENERGY DATA BOOK: ED
- Page 76 and 77:
TRANSPORTATION ENERGY DATA BOOK: ED
- Page 78 and 79:
The data on automobile and light tr
- Page 80 and 81:
TRANSPORTATION ENERGY DATA BOOK: ED
- Page 82 and 83:
The average age of automobiles was
- Page 84 and 85:
Using current registration data and
- Page 86 and 87:
Using current registration data and
- Page 88 and 89:
Using current registration data and
- Page 90 and 91:
Chapter 4 Light Vehicles and Charac
- Page 92 and 93:
The Federal Highway Administration
- Page 94 and 95:
Over one-quarter of autos sold in 2
- Page 96 and 97:
The sales-weighted fuel economy of
- Page 98 and 99:
Back in 1976 only 20% of new light
- Page 100 and 101:
The compact, midsize, and large aut
- Page 102 and 103:
The large car size class is the onl
- Page 104 and 105:
The sales-weighted wheelbase of new
- Page 106 and 107:
The number of franchised dealership
- Page 108 and 109:
The Corporate Average Fuel Economy
- Page 110 and 111:
Manufacturers of autos and light tr
- Page 112 and 113:
Consumers continue to demand gas gu
- Page 114 and 115:
Vehicle Table 4.23 Vehicle Specific
- Page 116 and 117:
Source: See Table 4.23. Figure 4.2.
- Page 118 and 119:
The Environmental Protection Agency
- Page 120 and 121:
The US06 driving cycle was develope
- Page 122 and 123:
When comparing data between countri
- Page 124 and 125:
In 2001, the fatality rate for vehi
- Page 126 and 127:
For fatal crashes in 2001, sport-ut
- Page 128 and 129:
Source Chapter 5 Heavy Vehicles and
- Page 130 and 131:
Combination trucks include all truc
- Page 132 and 133:
Vehicle Inventory and Use Survey Th
- Page 134 and 135:
As expected, most light trucks trav
- Page 136 and 137:
In 1997 nearly 60% of all truck fle
- Page 138 and 139:
Commodity Flow Survey The Commodity
- Page 140 and 141: Industries covered by the 1997 Comm
- Page 142 and 143: There are currently not many source
- Page 144 and 145: 6-2 Alternative Fuels The U.S. Depa
- Page 146 and 147: 6-4 Nearly 90% of private alternati
- Page 148 and 149: 6-6 This list includes public and p
- Page 150 and 151: 6-8 The Honda Insight, Civic Hybrid
- Page 152 and 153: 6-10 The relative efficiencies of s
- Page 154 and 155: 6-12 In 1999 (the latest year for w
- Page 156 and 157: 6-14 Table 6.10 Properties of Conve
- Page 158 and 159: Source Chapter 7 Fleet Vehicles and
- Page 160 and 161: According to these estimates of lig
- Page 162 and 163: These data, which apply to domestic
- Page 164 and 165: Table 7.6 Federal Fleet Vehicle Acq
- Page 166 and 167: Source Chapter 8 Household Vehicles
- Page 168 and 169: Vehicle-miles per capita have nearl
- Page 170 and 171: Household vehicle ownership shows a
- Page 172 and 173: Due to methodology improvements in
- Page 174 and 175: In 2001 vehicle-miles traveled (vmt
- Page 176 and 177: The average vehicle occupancy, calc
- Page 178 and 179: The average annual miles per vehicl
- Page 180 and 181: According to the U.S. Census data,
- Page 182 and 183: Sales of bicycles with wheel sizes
- Page 184 and 185: In 2001, 5% of walk trips and 8% of
- Page 186 and 187: Personal-use vehicles are by far th
- Page 188 and 189: Source Chapter 9 Nonhighway Modes S
- Page 192 and 193: In the early seventies, domestic wa
- Page 194 and 195: TRANSPORTATION ENERGY DATA BOOK: ED
- Page 196 and 197: The Interstate Commerce Commission
- Page 198 and 199: The “other” category, which con
- Page 200 and 201: The National Railroad Passenger Cor
- Page 202 and 203: This table on transit rail operatio
- Page 204 and 205: TRANSPORTATION ENERGY DATA BOOK: ED
- Page 206 and 207: TRANSPORTATION ENERGY DATA BOOK: ED
- Page 208 and 209: 10-6 Though the cost of crude oil c
- Page 210 and 211: 10-8 The fuel prices shown here are
- Page 212 and 213: 10-10 Table 10.7 State Taxes on Mot
- Page 214 and 215: 10-12 At the end of 2001, only four
- Page 216 and 217: 10-14 In current dollars, import ca
- Page 218 and 219: TRANSPORTATION ENERGY DATA BOOK: ED
- Page 220 and 221: 10-18 Knowing the number of employe
- Page 222 and 223: 11-2 The U. S. accounted for 23.0%
- Page 224 and 225: 11-4 Carbon dioxide emissions in 20
- Page 226 and 227: 11-6 Most U.S. transportation secto
- Page 228 and 229: Source Chapter 12 Criteria Air Poll
- Page 230 and 231: The transportation sector accounted
- Page 232 and 233: The transportation sector accounted
- Page 234 and 235: The transportation sector accounted
- Page 236 and 237: The transportation sector accounted
- Page 238 and 239: The transportation sector accounted
- Page 240 and 241:
The Greenhouse Gases, Regulated Emi
- Page 242 and 243:
TRANSPORTATION ENERGY DATA BOOK: ED
- Page 244 and 245:
TRANSPORTATION ENERGY DATA BOOK: ED
- Page 246 and 247:
TRANSPORTATION ENERGY DATA BOOK: ED
- Page 248 and 249:
TRANSPORTATION ENERGY DATA BOOK: ED
- Page 250 and 251:
TRANSPORTATION ENERGY DATA BOOK: ED
- Page 252 and 253:
APPENDIX A SOURCES & METHODOLOGIES
- Page 254 and 255:
Highway energy use Automobiles Ener
- Page 256 and 257:
Trucks Eno Transportation Foundatio
- Page 258 and 259:
Medium/Heavy Trucks: DOT, FHWA, Hig
- Page 260 and 261:
Nonhighway energy use Air General A
- Page 262 and 263:
Water Freight: Total - DOE, EIA, Fu
- Page 264 and 265:
Pipeline The sum of natural gas, cr
- Page 266 and 267:
Rail Freight: AAR, Railroad Facts,
- Page 268 and 269:
Transit - APTA, 2003 Transit Fact B
- Page 270 and 271:
Automobiles Passenger Travel and En
- Page 272 and 273:
Intercity School Air Passenger-mile
- Page 274 and 275:
Automobiles Highway Passenger Mode
- Page 276 and 277:
Air Certificated air carriers Nonhi
- Page 278 and 279:
Truck Freight Mode Energy Intensiti
- Page 280 and 281:
Sales - Domestic and import totals
- Page 282 and 283:
Trucks less than 8,500 lbs (Classes
- Page 284 and 285:
Light Fleet Vehicle Population Flee
- Page 286 and 287:
Light trucks Business Bobit Publish
- Page 288 and 289:
B-2 Pounds (lb) Table B.1 Hydrogen
- Page 290 and 291:
B-4 Table B.4 Fuel Equivalents 1 mi
- Page 292 and 293:
B-6 Table B.7 Distance and Velocity
- Page 294 and 295:
B-8 FROM Horsepower Kilowatts Table
- Page 296 and 297:
B-10 Table B.12 Fuel Efficiency Con
- Page 298 and 299:
B-12 Table B.14 Metric Units and Ab
- Page 300 and 301:
TRANSPORTATION ENERGY DATA BOOK: ED
- Page 302 and 303:
APPENDIX C MAPS TRANSPORTATION ENER
- Page 304 and 305:
Figure C1. Census Divisions and Reg
- Page 306 and 307:
Source: See Table C.2. Figure C.2.
- Page 308 and 309:
G-2 Alcohol - The family name of a
- Page 310 and 311:
G-4 Combination trucks - Consist of
- Page 312 and 313:
G-6 Energy capacity - Measured in k
- Page 314 and 315:
G-8 person living alone, two or mor
- Page 316 and 317:
G-10 M100 - 100% methanol. Medium t
- Page 318 and 319:
G-12 Poland, Portugal, Spain, Swede
- Page 320 and 321:
G-14 Proved Reserves of Crude Oil -
- Page 322 and 323:
G-16 Test weight - The weight setti
- Page 324 and 325:
TITLE INDEX TRANSPORTATION ENERGY D
- Page 326 and 327:
Automobiles (continued) Average Age
- Page 328 and 329:
(Category LDT3) ...................
- Page 330 and 331:
Countries Petroleum Stocks of OECD
- Page 332 and 333:
Light Truck Corporate Average Fuel
- Page 334 and 335:
Heavy Trucks.......................
- Page 336 and 337:
FY Federal Fleet Vehicle Acquisitio
- Page 338 and 339:
Incentives State Ethanol Incentives
- Page 340 and 341:
Mile Automobile Operating Cost per
- Page 342 and 343:
Oil World Crude Oil Production, 196
- Page 344 and 345:
Powered Federal Exhaust Emission Ce
- Page 346 and 347:
New Retail Sales of Trucks 10,000 p
- Page 348 and 349:
Standards Automobile Corporate Aver
- Page 350 and 351:
Time Average Length of Time Busines
- Page 352 and 353:
United States Petroleum Production,
- Page 354:
Workers Workers by Commute Time, 19