
Create successful ePaper yourself
Turn your PDF publications into a flip-book with our unique Google optimized e-Paper software.
Asset / Amenity<br />
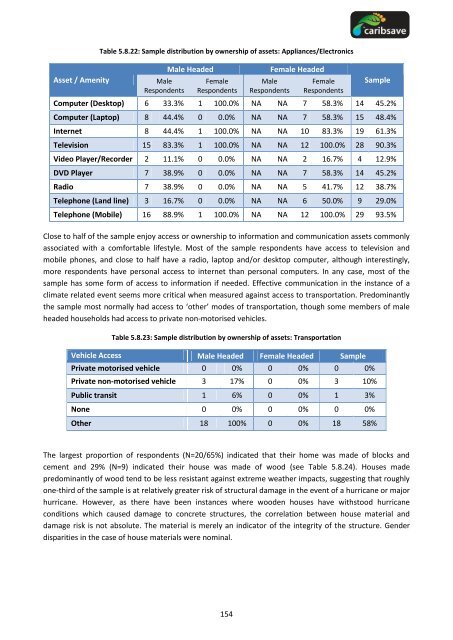
Table 5.8.22: Sample distribution by ownership of assets: Appliances/Electronics<br />
Male<br />
Respondents<br />
Male Headed Female Headed<br />
Female<br />
Respondents<br />
154<br />
Male<br />
Respondents<br />
Female<br />
Respondents<br />
Sample<br />
Computer (Desktop) 6 33.3% 1 100.0% NA NA 7 58.3% 14 45.2%<br />
Computer (Laptop) 8 44.4% 0 0.0% NA NA 7 58.3% 15 48.4%<br />
Internet 8 44.4% 1 100.0% NA NA 10 83.3% 19 61.3%<br />
Television 15 83.3% 1 100.0% NA NA 12 100.0% 28 90.3%<br />
Video Player/Recorder 2 11.1% 0 0.0% NA NA 2 16.7% 4 12.9%<br />
DVD Player 7 38.9% 0 0.0% NA NA 7 58.3% 14 45.2%<br />
Radio 7 38.9% 0 0.0% NA NA 5 41.7% 12 38.7%<br />
Telephone (L<strong>and</strong> line) 3 16.7% 0 0.0% NA NA 6 50.0% 9 29.0%<br />
Telephone (Mobile) 16 88.9% 1 100.0% NA NA 12 100.0% 29 93.5%<br />
Close to half of the sample enjoy access or ownership to information <strong>and</strong> communication assets commonly<br />
associated with a comfortable lifestyle. Most of the sample respondents have access to television <strong>and</strong><br />
mobile phones, <strong>and</strong> close to half have a radio, laptop <strong>and</strong>/or desktop computer, although interestingly,<br />
more respondents have personal access to internet than personal computers. In any case, most of the<br />
sample has some form of access to information if needed. Effective communication in the instance of a<br />
climate related event seems more critical when measured against access to transportation. Predominantly<br />
the sample most normally had access to ‘other’ modes of transportation, though some members of male<br />
headed households had access to private non-motorised vehicles.<br />
Table 5.8.23: Sample distribution by ownership of assets: Transportation<br />
Vehicle Access Male Headed Female Headed Sample<br />
Private motorised vehicle 0 0% 0 0% 0 0%<br />
Private non-motorised vehicle 3 17% 0 0% 3 10%<br />
Public transit 1 6% 0 0% 1 3%<br />
None 0 0% 0 0% 0 0%<br />
Other 18 100% 0 0% 18 58%<br />
The largest proportion of respondents (N=20/65%) indicated that their home was made of blocks <strong>and</strong><br />
cement <strong>and</strong> 29% (N=9) indicated their house was made of wood (see Table 5.8.24). Houses made<br />
predominantly of wood tend to be less resistant against extreme weather impacts, suggesting that roughly<br />
one-third of the sample is at relatively greater risk of structural damage in the event of a hurricane or major<br />
hurricane. However, as there have been instances where wooden houses have withstood hurricane<br />
conditions which caused damage to concrete structures, the correlation between house material <strong>and</strong><br />
damage risk is not absolute. The material is merely an indicator of the integrity of the structure. Gender<br />
disparities in the case of house materials were nominal.