
You also want an ePaper? Increase the reach of your titles
YUMPU automatically turns print PDFs into web optimized ePapers that Google loves.
Agriculture<br />
Nine respondents indicated they were involved in the agriculture sector. Of the respondents involved in<br />
agriculture, 40% of males always had access to water, <strong>and</strong> 60% sometimes had access to water. For female<br />
headed households, 75% always had access to water compared to 25% who sometimes had access to<br />
water, highlighting a higher level of access amongst women.<br />
Reliability of<br />
Water<br />
Table 5.8.32: Involvement in agriculture: Access to water<br />
Male Female<br />
Total Respondents<br />
Involved in Agriculture<br />
No.<br />
% of<br />
males<br />
No.<br />
% of<br />
females<br />
No.<br />
% of<br />
total<br />
Always 2 40% 3 75% 5 55.6%<br />
Sometimes 3 60% 1 25% 4 44.4%<br />
Never 0 0.0% 0 0.0% 0 0.0%<br />
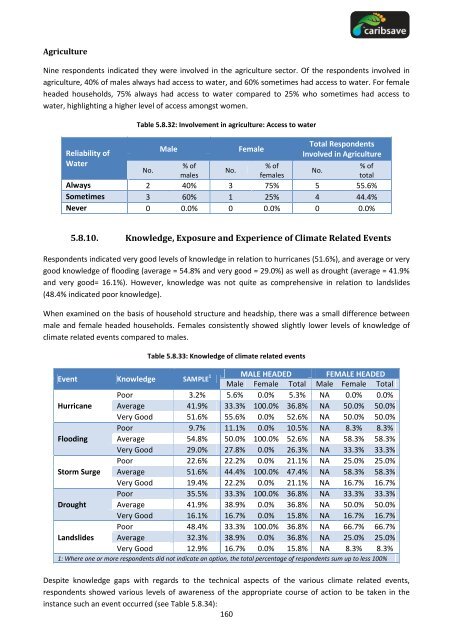
5.8.10. Knowledge, Exposure <strong>and</strong> Experience of Climate Related Events<br />
Respondents indicated very good levels of knowledge in relation to hurricanes (51.6%), <strong>and</strong> average or very<br />
good knowledge of flooding (average = 54.8% <strong>and</strong> very good = 29.0%) as well as drought (average = 41.9%<br />
<strong>and</strong> very good= 16.1%). However, knowledge was not quite as comprehensive in relation to l<strong>and</strong>slides<br />
(48.4% indicated poor knowledge).<br />
When examined on the basis of household structure <strong>and</strong> headship, there was a small difference between<br />
male <strong>and</strong> female headed households. Females consistently showed slightly lower levels of knowledge of<br />
climate related events compared to males.<br />
Table 5.8.33: Knowledge of climate related events<br />
Event Knowledge SAMPLE 1 MALE HEADED<br />
Male Female Total<br />
FEMALE HEADED<br />
Male Female Total<br />
Poor 3.2% 5.6% 0.0% 5.3% NA 0.0% 0.0%<br />
Hurricane Average 41.9% 33.3% 100.0% 36.8% NA 50.0% 50.0%<br />
Very Good 51.6% 55.6% 0.0% 52.6% NA 50.0% 50.0%<br />
Poor 9.7% 11.1% 0.0% 10.5% NA 8.3% 8.3%<br />
Flooding Average 54.8% 50.0% 100.0% 52.6% NA 58.3% 58.3%<br />
Very Good 29.0% 27.8% 0.0% 26.3% NA 33.3% 33.3%<br />
Poor 22.6% 22.2% 0.0% 21.1% NA 25.0% 25.0%<br />
Storm Surge Average 51.6% 44.4% 100.0% 47.4% NA 58.3% 58.3%<br />
Very Good 19.4% 22.2% 0.0% 21.1% NA 16.7% 16.7%<br />
Poor 35.5% 33.3% 100.0% 36.8% NA 33.3% 33.3%<br />
Drought Average 41.9% 38.9% 0.0% 36.8% NA 50.0% 50.0%<br />
Very Good 16.1% 16.7% 0.0% 15.8% NA 16.7% 16.7%<br />
Poor 48.4% 33.3% 100.0% 36.8% NA 66.7% 66.7%<br />
L<strong>and</strong>slides Average 32.3% 38.9% 0.0% 36.8% NA 25.0% 25.0%<br />
Very Good 12.9% 16.7% 0.0% 15.8% NA 8.3% 8.3%<br />
1: Where one or more respondents did not indicate an option, the total percentage of respondents sum up to less 100%<br />
Despite knowledge gaps with regards to the technical aspects of the various climate related events,<br />
respondents showed various levels of awareness of the appropriate course of action to be taken in the<br />
instance such an event occurred (see Table 5.8.34):<br />
160