- Page 1:
Great Western Hospitals NHS Foundat
- Page 5 and 6:
CONTENTS 1 Chair and Chief Executiv
- Page 7 and 8:
The Great Western Hospital became a
- Page 9 and 10:
Underpinning this, our values are t
- Page 11 and 12:
3.2 Principal activities of the Tru
- Page 13 and 14:
Further Companies Act Disclosures 3
- Page 15 and 16:
Business Review / Management Commen
- Page 17 and 18:
3. To ensure that staff are proud t
- Page 19 and 20:
6. To work in partnership with othe
- Page 21 and 22:
With funding received from the Depa
- Page 23 and 24:
3.13 Contractual arrangements The T
- Page 25 and 26:
Patient care 3.16 Development of se
- Page 27 and 28:
3.20 New or significantly revised s
- Page 29 and 30:
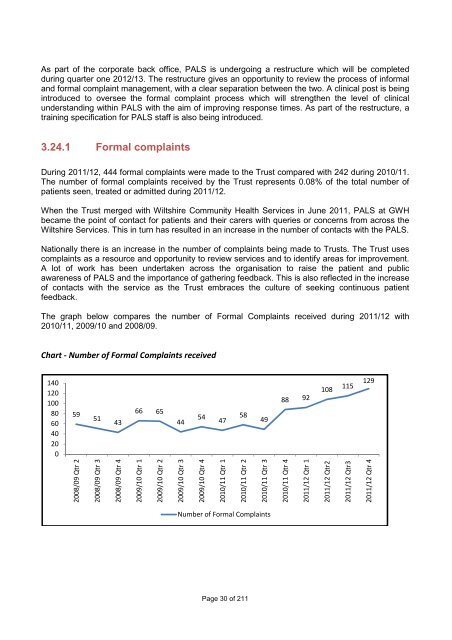
3.24 Complaints Handling For the Tr
- Page 31 and 32:
The Trust actively responds to feed
- Page 33 and 34:
3.25 Using patient experience to dr
- Page 35 and 36:
The table below shows the CQUIN res
- Page 37 and 38:
Action plans based on the Quarterly
- Page 39 and 40:
3.27 Development of services with o
- Page 41 and 42:
3.29 Health and Overview Scrutiny C
- Page 43 and 44:
3.32.5 Interests held by Directors
- Page 45 and 46:
4.3 Attendance at meetings of the R
- Page 47 and 48:
4.7 Board of Directors’ employmen
- Page 49 and 50:
Remuneration Name Title Salary (Ban
- Page 51 and 52:
4.8.4 Additional disclosures The Tr
- Page 53 and 54:
5.1.2 Elected Governors - Public Co
- Page 55 and 56:
5.1.4 Nominated Governors Name Nomi
- Page 57 and 58:
5.1.6 Lead and Deputy Lead Governor
- Page 59 and 60:
“Eyes and Ears” - An initiative
- Page 61 and 62:
5.1.12 Nominations and Remuneration
- Page 63 and 64:
Rowland Cobbold, Non-Executive Dire
- Page 65 and 66:
Lyn Hill-Tout, Chief Executive (unt
- Page 67 and 68:
5.2.3 Length of appointments of Non
- Page 69 and 70:
5.2.6 Attendance at meetings of the
- Page 71 and 72:
5.3 Audit Committee 5.3.1 The Audit
- Page 73 and 74:
5.4 Directors’ responsibility for
- Page 75 and 76:
Note: Angela Gillibrand and Rowland
- Page 77 and 78:
The Mental Health Act / Mental Capa
- Page 79 and 80:
The Trust has a wide range of staff
- Page 81 and 82:
5.8.6 Membership Strategy To encour
- Page 83 and 84:
5.9 Code of Governance Disclosure S
- Page 85 and 86:
6 QUALITY REPORTS Part 1 - Statemen
- Page 87 and 88:
Part 2 - Priorities for improvement
- Page 89 and 90:
6.3.1 Review of services and partic
- Page 91 and 92:
The trust chose not to contribute t
- Page 93 and 94:
No. Audit Title Reconstruction Audi
- Page 95 and 96:
The reports of 273 local clinical a
- Page 97 and 98:
No. Audit Title 15. Non Invasive Ve
- Page 99 and 100:
No. Audit Title Antibiotic Prescrib
- Page 101 and 102:
No. Audit Title 50. NICE CG111 - No
- Page 103 and 104:
Great Western Hospitals NHS Foundat
- Page 105 and 106:
Part 3 - Other Information 6.4 Over
- Page 107 and 108:
GRAPH - Clostridium Difficile WCHS2
- Page 109 and 110:
GRAPH - Medicine incidents by type
- Page 111 and 112:
Harm from falls WCHS: It was not po
- Page 113 and 114:
• Rolling educational programme w
- Page 115 and 116:
CHART - Relative risk SW Acute Trus
- Page 117 and 118:
Following the Trust’s merge in Ju
- Page 119 and 120:
Priority 7: Participation on the Re
- Page 121 and 122:
All the guidelines have been dissem
- Page 123 and 124:
This has been achieved by: • Mont
- Page 125 and 126:
• As a result of complaints and c
- Page 127 and 128:
CHART - National Sentinel Stroke Au
- Page 129 and 130:
Priority 16: To ensure patients are
- Page 131 and 132:
6.5 Care Quality Commission (CQC) I
- Page 133 and 134:
6.7 Statement of Directors’ respo
- Page 135 and 136:
a Quality Account and the opportuni
- Page 137 and 138:
Overall, the Trust has good plans t
- Page 139 and 140:
Page 139 of 211
- Page 141 and 142:
Graph 1 - GWH carbon footprint (ton
- Page 143 and 144:
The Trust is working with local bus
- Page 145 and 146:
Graph 9 - Total tonnes of waste pro
- Page 147 and 148:
The Trust will be working towards a
- Page 149 and 150:
Detailed below is a summary of the
- Page 151 and 152:
Wiltshire Community Health Services
- Page 153 and 154:
providers. Feedback obtained across
- Page 155 and 156:
The Musculoskeletal Disorder team a
- Page 157 and 158:
10.2.2 Governance risk rating The t
- Page 159 and 160:
11 OTHER DISCLOSURES IN PUBLIC INTE
- Page 161 and 162:
13 AUDITOR’S OPINION AND CERTIFIC
- Page 163 and 164:
14 ANNUAL GOVERNANCE STATEMENT 14.1
- Page 165 and 166:
• the key controls to mitigate ag
- Page 167 and 168:
14.4.6 Organisation Culture The Tru
- Page 169 and 170:
14.5 Review of economy, efficiency
- Page 171 and 172:
Process Board Role and Conclusions
- Page 173 and 174:
15 GLOSSARY OF TERMS BARS - Blood A
- Page 175 and 176:
16 FOREWORD TO THE ACCOUNTS 16.1 Fo
- Page 177 and 178:
Great Western Hospitals NHS Foundat
- Page 179 and 180:
Great Western Hospitals NHS Foundat
- Page 181 and 182:
Great Western Hospitals NHS Foundat
- Page 183 and 184:
Great Western Hospitals NHS Foundat
- Page 185 and 186:
Great Western Hospitals NHS Foundat
- Page 187 and 188:
Great Western Hospitals NHS Foundat
- Page 189 and 190: Great Western Hospitals NHS Foundat
- Page 191 and 192: Great Western Hospitals NHS Foundat
- Page 193 and 194: Great Western Hospitals NHS Foundat
- Page 195 and 196: Great Western Hospitals NHS Foundat
- Page 197 and 198: Great Western Hospitals NHS Foundat
- Page 199 and 200: Great Western Hospitals NHS Foundat
- Page 201 and 202: Great Western Hospitals NHS Foundat
- Page 203 and 204: Great Western Hospitals NHS Foundat
- Page 205 and 206: Great Western Hospitals NHS Foundat
- Page 207 and 208: Great Western Hospitals NHS Foundat
- Page 209: Great Western Hospitals NHS Foundat
- Page 214: Great Western Hospitals NHS Foundat
- Page 217 and 218: 1 CHAIR AND CHIEF EXECUTIVE’S REP
- Page 219 and 220: 2 OUR TRUST 2.1 Vision - Your healt
- Page 221 and 222: 3 DIRECTOR’S REPORT General Compa
- Page 223 and 224: 3.3.2 The Brunel Treatment Centre O
- Page 225 and 226: 14 In relation to the use of financ
- Page 227 and 228: Checklist, a World Health Organisat
- Page 229 and 230: organisations to adapt to these cha
- Page 231 and 232: TABLE - Wiltshire Community Activit
- Page 233 and 234: The Trust is currently reviewing it
- Page 235 and 236: Enhanced Quality Governance Reporti
- Page 237 and 238: The Trust is using its foundation t
- Page 239: of implementing the programme. Incl
- Page 243 and 244: What patients and service users hav
- Page 245 and 246: 3.25.3 Patient Surveys The PICKER I
- Page 247 and 248: 3.25.5 Annual Inpatient Survey The
- Page 249 and 250: CHART - Percentage of patients who
- Page 251 and 252: 3.28 Working with our partners to s
- Page 253 and 254: 3.31 Statement as to disclosures to
- Page 255 and 256: 4 REMUNERATION REPORT Information n
- Page 257 and 258: 4.5 Remuneration of senior managers
- Page 259 and 260: 4.8 Pension Benefits and Remunerati
- Page 261 and 262: The accounting policies for pension
- Page 263 and 264: 5 NHS FOUNDATION TRUST CODE OF GOVE
- Page 265 and 266: There is currently a vacancy for th
- Page 267 and 268: 5.1.5 Attendance at meetings of the
- Page 269 and 270: In addition, in preparing the Trust
- Page 271 and 272: 5.1.11 Council of Governors Meeting
- Page 273 and 274: 5.2 Board of Directors 5.2.1 The Bo
- Page 275 and 276: Roger Hill, Non-Executive Director
- Page 277 and 278: Helen Bourner, Director of Business
- Page 279 and 280: 5.2.4 Statement about the balance,
- Page 281 and 282: 5.2.9 Significant Commitments of th
- Page 283 and 284: 5.3.2 The work of the Audit, Risk a
- Page 285 and 286: 5.6 Nominations Committee 5.6.1 The
- Page 287 and 288: 5.7 Mental Health Act / Mental Capa
- Page 289 and 290: 5.8 Membership 5.8.1 Membership The
- Page 291 and 292:
The groupings of the members in the
- Page 293 and 294:
5.8.8 Membership development propos
- Page 295 and 296:
G.1.2 - The Board should clarify in
- Page 297 and 298:
and Governors. We have also commenc
- Page 299 and 300:
Regulation 1. To sustain compliance
- Page 301 and 302:
Audit / confidential enquiry title
- Page 303 and 304:
Audit Title Submitted/Required (%)
- Page 305 and 306:
No. Audit Title Learning From The P
- Page 307 and 308:
No. Audit Title 8. Diabetes Ketoaci
- Page 309 and 310:
No. Audit Title Audit Summary/Learn
- Page 311 and 312:
No. Audit Title Audit Summary/Learn
- Page 313 and 314:
6.3.4 Registration with Care Qualit
- Page 315 and 316:
Steering Group, provides a quarterl
- Page 317 and 318:
Clostridium Difficile: The goal for
- Page 319 and 320:
Priority 2: To reduce harm associat
- Page 321 and 322:
Priority 3: To reduce harm associat
- Page 323 and 324:
Pressure ulcers Community: The comm
- Page 325 and 326:
Safe care of the patient receiving
- Page 327 and 328:
CHART - Serious Incidents grouped b
- Page 329 and 330:
The three top serious incident caus
- Page 331 and 332:
West conference call in August 2011
- Page 333 and 334:
Priority 9: To review the clinical
- Page 335 and 336:
Priority 12: To undertake nutrition
- Page 337 and 338:
• A regular ongoing training prog
- Page 339 and 340:
Community: • Q1 Performance April
- Page 341 and 342:
The survey results demonstrate that
- Page 343 and 344:
6.6 Performance against key nationa
- Page 345 and 346:
6.8 Statements from Primary Care Tr
- Page 347 and 348:
6.8.4 Wiltshire Primary Care Trust
- Page 349 and 350:
6.9 Independent Assurance Report to
- Page 351 and 352:
7 SUSTAINABILITY REPORTING 7.1 Stro
- Page 353 and 354:
Graphs 3 and 4 show energy consumpt
- Page 355 and 356:
Graph 7 - Water consumption in WCHS
- Page 357 and 358:
8 EQUALITY REPORTING 8.1 Equality d
- Page 359 and 360:
9 STAFF SURVEY REPORT 9.1 Our staff
- Page 361 and 362:
It was agreed that we would focus o
- Page 363 and 364:
Appraisal rates. The overall rate f
- Page 365 and 366:
A quarterly “Voluntary Service Ma
- Page 367 and 368:
10 REGULATORY RATINGS REPORT 10.1 M
- Page 369 and 370:
10.3.2 Explanation for differences
- Page 371 and 372:
12 STATEMENT OF ACCOUNTING OFFICER
- Page 373 and 374:
Page 162 of 211
- Page 375 and 376:
14.4 The risk and control framework
- Page 377 and 378:
Risk Licence to operate (compliance
- Page 379 and 380:
The governors and wider stakeholder
- Page 381 and 382:
Steps which have been put in place
- Page 383 and 384:
14.8 Conclusion I have not identifi
- Page 385 and 386:
SHA - Strategic Health Authority SW
- Page 387 and 388:
Great Western Hospitals NHS Foundat
- Page 389 and 390:
Great Western Hospitals NHS Foundat
- Page 391 and 392:
Great Western Hospitals NHS Foundat
- Page 393 and 394:
Great Western Hospitals NHS Foundat
- Page 395 and 396:
Great Western Hospitals NHS Foundat
- Page 397 and 398:
Great Western Hospitals NHS Foundat
- Page 399 and 400:
Great Western Hospitals NHS Foundat
- Page 401 and 402:
Great Western Hospitals NHS Foundat
- Page 403 and 404:
Great Western Hospitals NHS Foundat
- Page 405 and 406:
Great Western Hospitals NHS Foundat
- Page 407 and 408:
Great Western Hospitals NHS Foundat
- Page 409 and 410:
Great Western Hospitals NHS Foundat
- Page 411 and 412:
Great Western Hospitals NHS Foundat
- Page 413 and 414:
Great Western Hospitals NHS Foundat
- Page 415 and 416:
Great Western Hospitals NHS Foundat
- Page 417 and 418:
Great Western Hospitals NHS Foundat
- Page 419 and 420:
Great Western Hospitals NHS Foundat