

Evaluation of the Ticket to Work Program Initial Evaluation Report
Evaluation of the Ticket to Work Program Initial Evaluation Report
Evaluation of the Ticket to Work Program Initial Evaluation Report

You also want an ePaper? Increase the reach of your titles
YUMPU automatically turns print PDFs into web optimized ePapers that Google loves.
84<br />
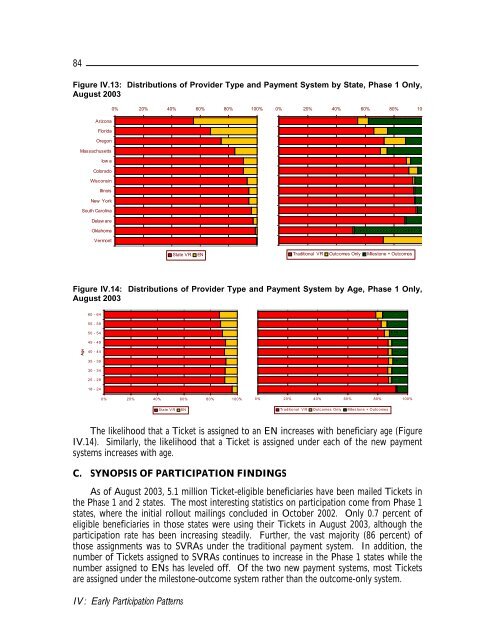
Figure IV.13: Distributions <strong>of</strong> Provider Type and Payment System by State, Phase 1 Only,<br />
August 2003<br />
0% 20% 40% 60% 80% 100%<br />
0% 20% 40% 60% 80% 10<br />
Arizona<br />
Florida<br />
Oregon<br />
Massachusetts<br />
Iow a<br />
Colorado<br />
Wisconsin<br />
Illinois<br />
New York<br />
South Carolina<br />
Delaw are<br />
Oklahoma<br />
Vermont<br />
State VR<br />
EN<br />
Traditional VR Outcomes Only Miles<strong>to</strong>ne + Outcomes<br />
Figure IV.14: Distributions <strong>of</strong> Provider Type and Payment System by Age, Phase 1 Only,<br />
August 2003<br />
60 - 64<br />
55 - 59<br />
50 - 54<br />
45 - 49<br />
Age<br />
40 - 44<br />
35 - 39<br />
30 - 34<br />
25 - 29<br />
18 - 24<br />
0% 20% 40% 60% 80% 100%<br />
0% 20% 40% 60% 80% 100%<br />
State VR<br />
EN<br />
Traditional V R Outcomes Only Miles<strong>to</strong>ne + Outcomes<br />
The likelihood that a <strong>Ticket</strong> is assigned <strong>to</strong> an EN increases with beneficiary age (Figure<br />
IV.14). Similarly, <strong>the</strong> likelihood that a <strong>Ticket</strong> is assigned under each <strong>of</strong> <strong>the</strong> new payment<br />
systems increases with age.<br />
C. SYNOPSIS OF PARTICIPATION FINDINGS<br />
As <strong>of</strong> August 2003, 5.1 million <strong>Ticket</strong>-eligible beneficiaries have been mailed <strong>Ticket</strong>s in<br />
<strong>the</strong> Phase 1 and 2 states. The most interesting statistics on participation come from Phase 1<br />
states, where <strong>the</strong> initial rollout mailings concluded in Oc<strong>to</strong>ber 2002. Only 0.7 percent <strong>of</strong><br />
eligible beneficiaries in those states were using <strong>the</strong>ir <strong>Ticket</strong>s in August 2003, although <strong>the</strong><br />
participation rate has been increasing steadily. Fur<strong>the</strong>r, <strong>the</strong> vast majority (86 percent) <strong>of</strong><br />
those assignments was <strong>to</strong> SVRAs under <strong>the</strong> traditional payment system. In addition, <strong>the</strong><br />
number <strong>of</strong> <strong>Ticket</strong>s assigned <strong>to</strong> SVRAs continues <strong>to</strong> increase in <strong>the</strong> Phase 1 states while <strong>the</strong><br />
number assigned <strong>to</strong> ENs has leveled <strong>of</strong>f. Of <strong>the</strong> two new payment systems, most <strong>Ticket</strong>s<br />
are assigned under <strong>the</strong> miles<strong>to</strong>ne-outcome system ra<strong>the</strong>r than <strong>the</strong> outcome-only system.<br />
IV: Early Participation Patterns


