

Evaluation of the Ticket to Work Program Initial Evaluation Report
Evaluation of the Ticket to Work Program Initial Evaluation Report
Evaluation of the Ticket to Work Program Initial Evaluation Report

Create successful ePaper yourself
Turn your PDF publications into a flip-book with our unique Google optimized e-Paper software.
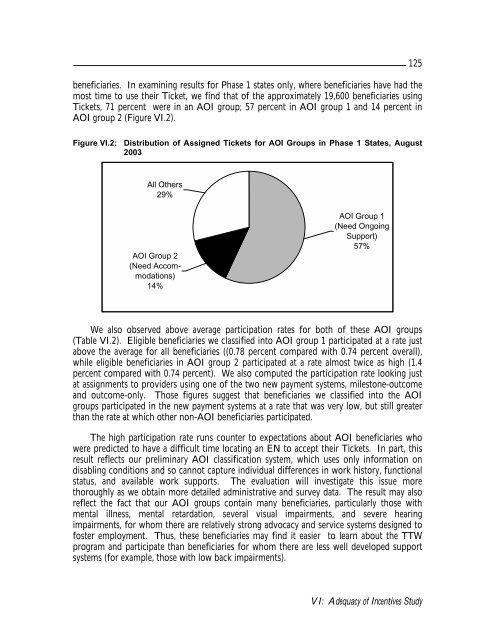
eneficiaries. In examining results for Phase 1 states only, where beneficiaries have had <strong>the</strong><br />
most time <strong>to</strong> use <strong>the</strong>ir <strong>Ticket</strong>, we find that <strong>of</strong> <strong>the</strong> approximately 19,600 beneficiaries using<br />
<strong>Ticket</strong>s, 71 percent were in an AOI group; 57 percent in AOI group 1 and 14 percent in<br />
AOI group 2 (Figure VI.2).<br />
125<br />
Figure VI.2: Distribution <strong>of</strong> Assigned <strong>Ticket</strong>s for AOI Groups in Phase 1 States, August<br />
2003<br />
All O<strong>the</strong>rs<br />
29%<br />
AOI Group 2<br />
(Need Accommodations)<br />
14%<br />
AOI Group 1<br />
(Need Ongoing<br />
Support)<br />
57%<br />
We also observed above average participation rates for both <strong>of</strong> <strong>the</strong>se AOI groups<br />
(Table VI.2). Eligible beneficiaries we classified in<strong>to</strong> AOI group 1 participated at a rate just<br />
above <strong>the</strong> average for all beneficiaries ((0.78 percent compared with 0.74 percent overall),<br />
while eligible beneficiaries in AOI group 2 participated at a rate almost twice as high (1.4<br />
percent compared with 0.74 percent). We also computed <strong>the</strong> participation rate looking just<br />
at assignments <strong>to</strong> providers using one <strong>of</strong> <strong>the</strong> two new payment systems, miles<strong>to</strong>ne-outcome<br />
and outcome-only. Those figures suggest that beneficiaries we classified in<strong>to</strong> <strong>the</strong> AOI<br />
groups participated in <strong>the</strong> new payment systems at a rate that was very low, but still greater<br />
than <strong>the</strong> rate at which o<strong>the</strong>r non-AOI beneficiaries participated.<br />
The high participation rate runs counter <strong>to</strong> expectations about AOI beneficiaries who<br />
were predicted <strong>to</strong> have a difficult time locating an EN <strong>to</strong> accept <strong>the</strong>ir <strong>Ticket</strong>s. In part, this<br />
result reflects our preliminary AOI classification system, which uses only information on<br />
disabling conditions and so cannot capture individual differences in work his<strong>to</strong>ry, functional<br />
status, and available work supports. The evaluation will investigate this issue more<br />
thoroughly as we obtain more detailed administrative and survey data. The result may also<br />
reflect <strong>the</strong> fact that our AOI groups contain many beneficiaries, particularly those with<br />
mental illness, mental retardation, several visual impairments, and severe hearing<br />
impairments, for whom <strong>the</strong>re are relatively strong advocacy and service systems designed <strong>to</strong><br />
foster employment. Thus, <strong>the</strong>se beneficiaries may find it easier <strong>to</strong> learn about <strong>the</strong> TTW<br />
program and participate than beneficiaries for whom <strong>the</strong>re are less well developed support<br />
systems (for example, those with low back impairments).<br />
VI: Adequacy <strong>of</strong> Incentives Study


