

Evaluation of the Ticket to Work Program Initial Evaluation Report
Evaluation of the Ticket to Work Program Initial Evaluation Report
Evaluation of the Ticket to Work Program Initial Evaluation Report

Create successful ePaper yourself
Turn your PDF publications into a flip-book with our unique Google optimized e-Paper software.
77<br />
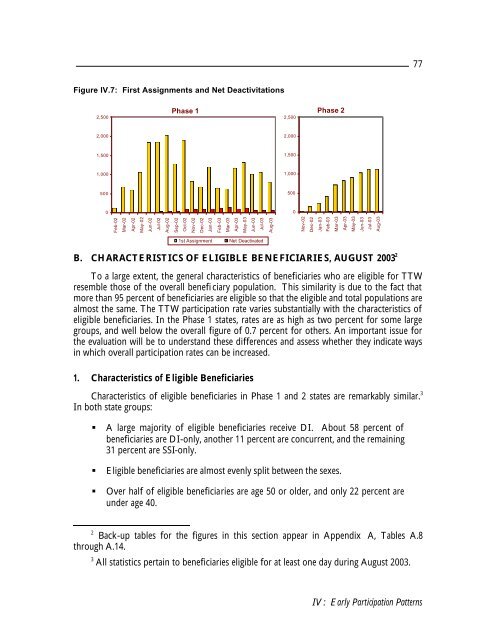
Figure IV.7: First Assignments and Net Deactivitations<br />
2,500<br />
Phase 1<br />
2,500<br />
Phase 2<br />
2,000<br />
2,000<br />
1,500<br />
1,500<br />
1,000<br />
1,000<br />
500<br />
500<br />
0<br />
0<br />
Feb-02<br />
Mar-02<br />
Apr-02<br />
May-02<br />
Jun-02<br />
Jul-02<br />
Aug-02<br />
Sep-02<br />
Oct-02<br />
Nov-02<br />
Dec-02<br />
Jan-03<br />
Feb-03<br />
Mar-03<br />
Apr-03<br />
May-03<br />
Jun-03<br />
Jul-03<br />
Aug-03<br />
Nov-02<br />
Dec-02<br />
Jan-03<br />
Feb-03<br />
Mar-03<br />
Apr-03<br />
May-03<br />
Jun-03<br />
Jul-03<br />
Aug-03<br />
1st Assignment<br />
Net Deactivated<br />
B. CHARACTERISTICS OF ELIGIBLE BENEFICIARIES, AUGUST 2003 2<br />
To a large extent, <strong>the</strong> general characteristics <strong>of</strong> beneficiaries who are eligible for TTW<br />
resemble those <strong>of</strong> <strong>the</strong> overall benefi ciary population. This similarity is due <strong>to</strong> <strong>the</strong> fact that<br />
more than 95 percent <strong>of</strong> beneficiaries are eligible so that <strong>the</strong> eligible and <strong>to</strong>tal populations are<br />
almost <strong>the</strong> same. The TTW participation rate varies substantially with <strong>the</strong> characteristics <strong>of</strong><br />
eligible beneficiaries. In <strong>the</strong> Phase 1 states, rates are as high as two percent for some large<br />
groups, and well below <strong>the</strong> overall figure <strong>of</strong> 0.7 percent for o<strong>the</strong>rs. An important issue for<br />
<strong>the</strong> evaluation will be <strong>to</strong> understand <strong>the</strong>se differences and assess whe<strong>the</strong>r <strong>the</strong>y indicate ways<br />
in which overall participation rates can be increased.<br />
1. Characteristics <strong>of</strong> Eligible Beneficiaries<br />
Characteristics <strong>of</strong> eligible beneficiaries in Phase 1 and 2 states are remarkably similar. 3<br />
In both state groups:<br />
• A large majority <strong>of</strong> eligible beneficiaries receive DI. About 58 percent <strong>of</strong><br />
beneficiaries are DI-only, ano<strong>the</strong>r 11 percent are concurrent, and <strong>the</strong> remaining<br />
31 percent are SSI-only.<br />
• Eligible beneficiaries are almost evenly split between <strong>the</strong> sexes.<br />
• Over half <strong>of</strong> eligible beneficiaries are age 50 or older, and only 22 percent are<br />
under age 40.<br />
2 Back-up tables for <strong>the</strong> figures in this section appear in Appendix A, Tables A.8<br />
through A.14.<br />
3 All statistics pertain <strong>to</strong> beneficiaries eligible for at least one day during August 2003.<br />
IV: Early Participation Patterns


