

Evaluation of the Ticket to Work Program Initial Evaluation Report
Evaluation of the Ticket to Work Program Initial Evaluation Report
Evaluation of the Ticket to Work Program Initial Evaluation Report

You also want an ePaper? Increase the reach of your titles
YUMPU automatically turns print PDFs into web optimized ePapers that Google loves.
81<br />
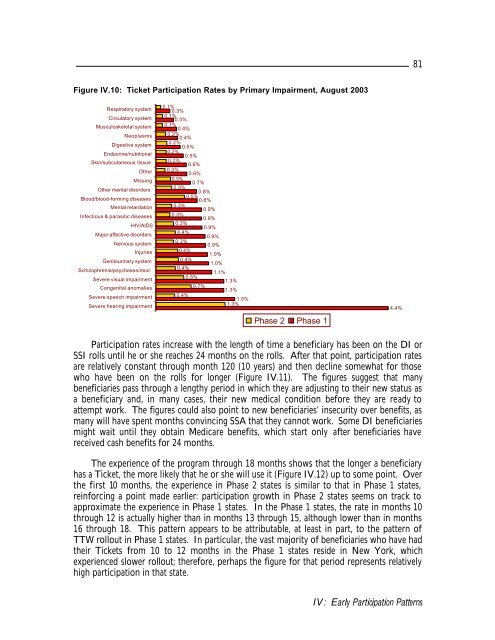
Figure IV.10: <strong>Ticket</strong> Participation Rates by Primary Impairment, August 2003<br />
Respira<strong>to</strong>ry system<br />
Circula<strong>to</strong>ry system<br />
Musculoskeletal system<br />
Neoplasms<br />
Digestive system<br />
Endocrine/nutritional<br />
Skin/subcutaneous tissue<br />
O<strong>the</strong>r<br />
Missing<br />
O<strong>the</strong>r mental disorders<br />
Blood/blood-forming diseases<br />
Mental retardation<br />
Infectious & parasitic diseases<br />
HIV/AIDS<br />
Major affective disorders<br />
Nervous system<br />
Injuries<br />
Geni<strong>to</strong>urinary system<br />
Schizophrenia/psychoses/neur.<br />
Severe visual impairment<br />
Congenital anomalies<br />
Severe speech impairment<br />
Severe hearing impairment<br />
0.1%<br />
0.3%<br />
0.1%<br />
0.3%<br />
0.1%<br />
0.4%<br />
0.2%<br />
0.4%<br />
0.2%<br />
0.5%<br />
0.2%<br />
0.5%<br />
0.2%<br />
0.6%<br />
0.2%<br />
0.6%<br />
0.3%<br />
0.7%<br />
0.3%<br />
0.8%<br />
0.5%<br />
0.8%<br />
0.3%<br />
0.9%<br />
0.3%<br />
0.9%<br />
0.3%<br />
0.9%<br />
0.4%<br />
0.9%<br />
0.3%<br />
0.9%<br />
0.4%<br />
1.0%<br />
0.4%<br />
1.0%<br />
0.4%<br />
1.1%<br />
0.5%<br />
1.3%<br />
0.7%<br />
1.3%<br />
0.4%<br />
1.5%<br />
1.3%<br />
Phase 2 Phase 1<br />
4.4%<br />
Participation rates increase with <strong>the</strong> length <strong>of</strong> time a beneficiary has been on <strong>the</strong> DI or<br />
SSI rolls until he or she reaches 24 months on <strong>the</strong> rolls. After that point, participation rates<br />
are relatively constant through month 120 (10 years) and <strong>the</strong>n decline somewhat for those<br />
who have been on <strong>the</strong> rolls for longer (Figure IV.11). The figures suggest that many<br />
beneficiaries pass through a lengthy period in which <strong>the</strong>y are adjusting <strong>to</strong> <strong>the</strong>ir new status as<br />
a beneficiary and, in many cases, <strong>the</strong>ir new medical condition before <strong>the</strong>y are ready <strong>to</strong><br />
attempt work. The figures could also point <strong>to</strong> new beneficiaries’ insecurity over benefits, as<br />
many will have spent months convincing SSA that <strong>the</strong>y cannot work. Some DI beneficiaries<br />
might wait until <strong>the</strong>y obtain Medicare benefits, which start only after beneficiaries have<br />
received cash benefits for 24 months.<br />
The experience <strong>of</strong> <strong>the</strong> program through 18 months shows that <strong>the</strong> longer a beneficiary<br />
has a <strong>Ticket</strong>, <strong>the</strong> more likely that he or she will use it (Figure IV.12) up <strong>to</strong> some point. Over<br />
<strong>the</strong> first 10 months, <strong>the</strong> experience in Phase 2 states is similar <strong>to</strong> that in Phase 1 states,<br />
reinforcing a point made earlier: participation growth in Phase 2 states seems on track <strong>to</strong><br />
approximate <strong>the</strong> experience in Phase 1 states. In <strong>the</strong> Phase 1 states, <strong>the</strong> rate in months 10<br />
through 12 is actually higher than in months 13 through 15, although lower than in months<br />
16 through 18. This pattern appears <strong>to</strong> be attributable, at least in part, <strong>to</strong> <strong>the</strong> pattern <strong>of</strong><br />
TTW rollout in Phase 1 states. In particular, <strong>the</strong> vast majority <strong>of</strong> beneficiaries who have had<br />
<strong>the</strong>ir <strong>Ticket</strong>s from 10 <strong>to</strong> 12 months in <strong>the</strong> Phase 1 states reside in New York, which<br />
experienced slower rollout; <strong>the</strong>refore, perhaps <strong>the</strong> figure for that period represents relatively<br />
high participation in that state.<br />
IV: Early Participation Patterns


