

Evaluation of the Ticket to Work Program Initial Evaluation Report
Evaluation of the Ticket to Work Program Initial Evaluation Report
Evaluation of the Ticket to Work Program Initial Evaluation Report

Create successful ePaper yourself
Turn your PDF publications into a flip-book with our unique Google optimized e-Paper software.
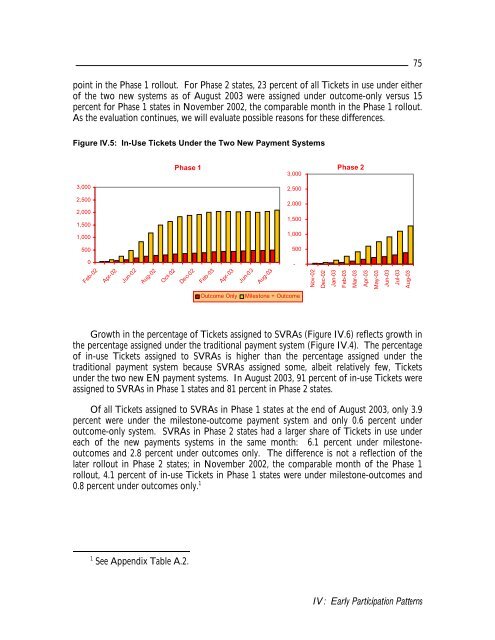
point in <strong>the</strong> Phase 1 rollout. For Phase 2 states, 23 percent <strong>of</strong> all <strong>Ticket</strong>s in use under ei<strong>the</strong>r<br />
<strong>of</strong> <strong>the</strong> two new systems as <strong>of</strong> August 2003 were assigned under outcome-only versus 15<br />
percent for Phase 1 states in November 2002, <strong>the</strong> comparable month in <strong>the</strong> Phase 1 rollout.<br />
As <strong>the</strong> evaluation continues, we will evaluate possible reasons for <strong>the</strong>se differences.<br />
75<br />
Figure IV.5: In-Use <strong>Ticket</strong>s Under <strong>the</strong> Two New Payment Systems<br />
Phase 1<br />
3,000<br />
Phase 2<br />
3,000<br />
2,500<br />
2,500<br />
2,000<br />
1,500<br />
1,000<br />
2,000<br />
1,500<br />
1,000<br />
500<br />
500<br />
0<br />
Feb-02<br />
Apr-02<br />
Jun-02<br />
Aug-02<br />
Oct-02<br />
Dec-02<br />
Feb-03<br />
Apr-03<br />
Jun-03<br />
Aug-03<br />
-<br />
Nov-02<br />
Dec-02<br />
Jan-03<br />
Feb-03<br />
Mar-03<br />
Apr-03<br />
May-03<br />
Jun-03<br />
Jul-03<br />
Aug-03<br />
Outcome Only<br />
Miles<strong>to</strong>ne + Outcome<br />
Growth in <strong>the</strong> percentage <strong>of</strong> <strong>Ticket</strong>s assigned <strong>to</strong> SVRAs (Figure IV.6) reflects growth in<br />
<strong>the</strong> percentage assigned under <strong>the</strong> traditional payment system (Figure IV.4). The percentage<br />
<strong>of</strong> in-use <strong>Ticket</strong>s assigned <strong>to</strong> SVRAs is higher than <strong>the</strong> percentage assigned under <strong>the</strong><br />
traditional payment system because SVRAs assigned some, albeit relatively few, <strong>Ticket</strong>s<br />
under <strong>the</strong> two new EN payment systems. In August 2003, 91 percent <strong>of</strong> in-use <strong>Ticket</strong>s were<br />
assigned <strong>to</strong> SVRAs in Phase 1 states and 81 percent in Phase 2 states.<br />
Of all <strong>Ticket</strong>s assigned <strong>to</strong> SVRAs in Phase 1 states at <strong>the</strong> end <strong>of</strong> August 2003, only 3.9<br />
percent were under <strong>the</strong> miles<strong>to</strong>ne-outcome payment system and only 0.6 percent under<br />
outcome-only system. SVRAs in Phase 2 states had a larger share <strong>of</strong> <strong>Ticket</strong>s in use under<br />
each <strong>of</strong> <strong>the</strong> new payments systems in <strong>the</strong> same month: 6.1 percent under miles<strong>to</strong>neoutcomes<br />
and 2.8 percent under outcomes only. The difference is not a reflection <strong>of</strong> <strong>the</strong><br />
later rollout in Phase 2 states; in November 2002, <strong>the</strong> comparable month <strong>of</strong> <strong>the</strong> Phase 1<br />
rollout, 4.1 percent <strong>of</strong> in-use <strong>Ticket</strong>s in Phase 1 states were under miles<strong>to</strong>ne-outcomes and<br />
0.8 percent under outcomes only. 1<br />
1 See Appendix Table A.2.<br />
IV: Early Participation Patterns


