

Evaluation of the Ticket to Work Program Initial Evaluation Report
Evaluation of the Ticket to Work Program Initial Evaluation Report
Evaluation of the Ticket to Work Program Initial Evaluation Report

Create successful ePaper yourself
Turn your PDF publications into a flip-book with our unique Google optimized e-Paper software.
74<br />
After some initial ups and downs that reflect <strong>the</strong> rapidly growing number <strong>of</strong> <strong>Ticket</strong>s<br />
mailed, <strong>the</strong> participation rate has increased steadily among beneficiaries in both Phase 1 and<br />
Phase 2 states. The rate in Phase 2 states is much lower but appears <strong>to</strong> reflect <strong>the</strong> more<br />
recent rollout <strong>of</strong> <strong>Ticket</strong>s in those states. The August 2003 participation rate in <strong>the</strong> Phase 2<br />
states is similar <strong>to</strong> <strong>the</strong> participation rate in <strong>the</strong> Phase 1 states in June and July 2002, when <strong>the</strong><br />
initial Phase 1 mailings were nearing completion. Growth in <strong>the</strong> participation rate in Phase 1<br />
states has continued steadily from <strong>the</strong> end <strong>of</strong> <strong>the</strong> initial mailings through August 2003. We<br />
would expect <strong>the</strong> experience in <strong>the</strong> Phase 2 states <strong>to</strong> be similar over <strong>the</strong> next 12 months.<br />
3. Payment and Provider Type<br />
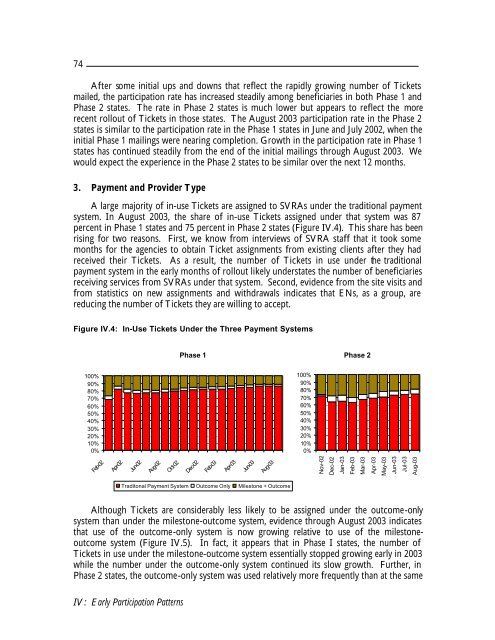
A large majority <strong>of</strong> in-use <strong>Ticket</strong>s are assigned <strong>to</strong> SVRAs under <strong>the</strong> traditional payment<br />
system. In August 2003, <strong>the</strong> share <strong>of</strong> in-use <strong>Ticket</strong>s assigned under that system was 87<br />
percent in Phase 1 states and 75 percent in Phase 2 states (Figure IV.4). This share has been<br />
rising for two reasons. First, we know from interviews <strong>of</strong> SVRA staff that it <strong>to</strong>ok some<br />
months for <strong>the</strong> agencies <strong>to</strong> obtain <strong>Ticket</strong> assignments from existing clients after <strong>the</strong>y had<br />
received <strong>the</strong>ir <strong>Ticket</strong>s. As a result, <strong>the</strong> number <strong>of</strong> <strong>Ticket</strong>s in use under <strong>the</strong> traditional<br />
payment system in <strong>the</strong> early months <strong>of</strong> rollout likely understates <strong>the</strong> number <strong>of</strong> beneficiaries<br />
receiving services from SVRAs under that system. Second, evidence from <strong>the</strong> site visits and<br />
from statistics on new assignments and withdrawals indicates that ENs, as a group, are<br />
reducing <strong>the</strong> number <strong>of</strong> <strong>Ticket</strong>s <strong>the</strong>y are willing <strong>to</strong> accept.<br />
Figure IV.4: In-Use <strong>Ticket</strong>s Under <strong>the</strong> Three Payment Systems<br />
Phase 1<br />
Phase 2<br />
100%<br />
90%<br />
80%<br />
70%<br />
60%<br />
50%<br />
40%<br />
30%<br />
20%<br />
10%<br />
0%<br />
100%<br />
90%<br />
80%<br />
70%<br />
60%<br />
50%<br />
40%<br />
30%<br />
20%<br />
10%<br />
0%<br />
Feb-02<br />
Apr-02<br />
Jun-02<br />
Aug-02<br />
Oct-02<br />
Dec-02<br />
Feb-03<br />
Apr-03<br />
Jun-03<br />
Aug-03<br />
Nov-02<br />
Dec-02<br />
Jan-03<br />
Feb-03<br />
Mar-03<br />
Apr-03<br />
May-03<br />
Jun-03<br />
Jul-03<br />
Aug-03<br />
Tradi<strong>to</strong>nal Payment System Outcome Only Miles<strong>to</strong>ne + Outcome<br />
Although <strong>Ticket</strong>s are considerably less likely <strong>to</strong> be assigned under <strong>the</strong> outcome-only<br />
system than under <strong>the</strong> miles<strong>to</strong>ne-outcome system, evidence through August 2003 indicates<br />
that use <strong>of</strong> <strong>the</strong> outcome-only system is now growing relative <strong>to</strong> use <strong>of</strong> <strong>the</strong> miles<strong>to</strong>neoutcome<br />
system (Figure IV.5). In fact, it appears that in Phase I states, <strong>the</strong> number <strong>of</strong><br />
<strong>Ticket</strong>s in use under <strong>the</strong> miles<strong>to</strong>ne-outcome system essentially s<strong>to</strong>pped growing early in 2003<br />
while <strong>the</strong> number under <strong>the</strong> outcome-only system continued its slow growth. Fur<strong>the</strong>r, in<br />
Phase 2 states, <strong>the</strong> outcome-only system was used relatively more frequently than at <strong>the</strong> same<br />
IV: Early Participation Patterns


