- Page 1 and 2:
Contract No.: 0600-03-60130 MPR Ref
- Page 3 and 4:
A CKNOWLEDGMENTS This report benefi
- Page 5 and 6:
C ONTENTS Chapter Page ACRONYMS ...
- Page 7 and 8:
vii Chapter Page V (continued) D. C
- Page 9 and 10:
A CRONYMS ABIL AIDS AWICs AOI BPAO
- Page 11 and 12:
E XECUTIVE S UMMARY T he Ticket to
- Page 13 and 14:
Overall, we found that SSA has impl
- Page 15 and 16:
money on their TTW operations. For
- Page 17 and 18:
xvii CONCLUDING OBSERVATIONS SSA fa
- Page 19 and 20:
C HAPTER I O VERVIEW OF THE T ICKET
- Page 21 and 22:
The TTW program and other elements
- Page 23 and 24:
A. EVALUATION COMPONENTS: GOALS, SC
- Page 25 and 26:
7 ! How many beneficiaries particip
- Page 27 and 28:
9 B. PURPOSE AND ORGANIZATION OF TH
- Page 29 and 30:
C HAPTER II S TRUCTURE AND B ACKGRO
- Page 31 and 32:
In reality, however, the success of
- Page 33 and 34:
MAXIMUS to serve as the Program Man
- Page 35 and 36:
17 4. Participate in the activities
- Page 37 and 38:
N Decision Reversed Request SSA Rev
- Page 39 and 40:
21 c. Dispute Resolution In a progr
- Page 41 and 42:
Table II.1: Outcome-Only and Milest
- Page 43 and 44:
milestone payment is equal to 34 pe
- Page 45 and 46:
Unemployment Insurance (UI) wage da
- Page 47 and 48:
29 3. Related Initiatives TTW has n
- Page 49 and 50:
SSA Demonstrations. SSA plans to im
- Page 51 and 52:
Protection and Advocacy. The SSA-fu
- Page 53 and 54:
C HAPTER III TTW EARLY I MPLEMENTAT
- Page 55 and 56:
37 Table III.1: TTW Implementation
- Page 57 and 58:
Ticket-eligible beneficiaries were
- Page 59 and 60:
41 TTW. In the past, SSA systems ha
- Page 61 and 62:
information in SSA’s records cont
- Page 63 and 64:
work period automation and tracking
- Page 65 and 66:
Systems and Infrastructure. The Pro
- Page 67 and 68:
49 asked the Program Manager for a
- Page 69 and 70:
51 • The first payment for each b
- Page 71 and 72:
currently being addressed relate to
- Page 73 and 74:
payment system. Only one SVRA (Okla
- Page 75 and 76:
SVRA personnel have consistently ex
- Page 77 and 78:
59 • Are SVRAs permitted to requi
- Page 79 and 80:
Table III.4: ENs and ENs with Ticke
- Page 81 and 82:
Payment System. Many ENs do not bel
- Page 83 and 84:
example, reporting lags inherent in
- Page 85 and 86:
eceived only small amounts thus far
- Page 87 and 88:
SVRA services for Ticket clients; (
- Page 89 and 90:
C HAPTER IV E ARLY P ARTICIPATION P
- Page 91 and 92:
73 Figure IV.2: Cumulative Number o
- Page 93 and 94:
point in the Phase 1 rollout. For P
- Page 95 and 96:
77 Figure IV.7: First Assignments a
- Page 97 and 98:
79 Figure IV.8: Ticket Participatio
- Page 99 and 100:
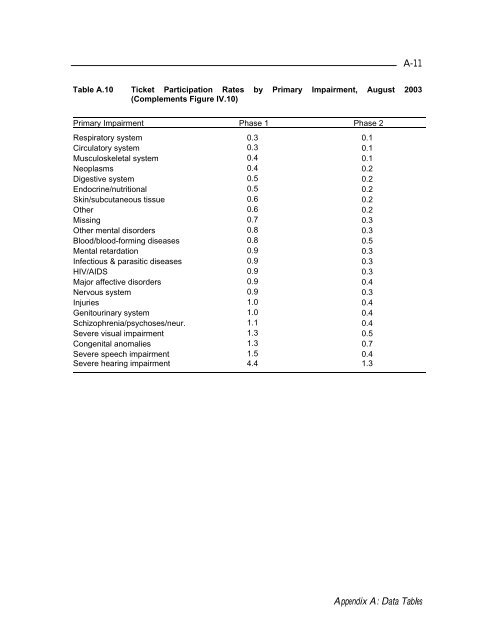
81 Figure IV.10: Ticket Participati
- Page 101 and 102:
83 states. This finding suggests th
- Page 103 and 104:
There is a strong negative relation
- Page 105 and 106:
C HAPTER V C ASE S TUDIES OF E IGHT
- Page 107 and 108:
89 A. SERVICE MODELS AND TARGETED C
- Page 109 and 110:
Although the director was initially
- Page 111 and 112:
Clients who assign their Tickets to
- Page 113 and 114:
session. Those who miss their appoi
- Page 115 and 116:
interview. While this is time consu
- Page 117 and 118:
claim employer tax credits. Through
- Page 119 and 120: these individuals, because they typ
- Page 121 and 122: 103 F. RELATIONS WITH OTHER ORGANIZ
- Page 123 and 124: eneficiaries to meet that standard.
- Page 125 and 126: IDR representatives said that to da
- Page 127 and 128: substantiate wages, and clients are
- Page 129 and 130: services? Unfortunately, for ENs to
- Page 131 and 132: Manager. At present, this is only p
- Page 133 and 134: stubs: the need for beneficiaries t
- Page 135 and 136: C HAPTER VI A DEQUACY OF I NCENTIVE
- Page 137 and 138: We have also begun to analyze admin
- Page 139 and 140: viewed as lacking the productive ca
- Page 141 and 142: assist in the identification of ind
- Page 143 and 144: eneficiaries. In examining results
- Page 145 and 146: 127 E. CONCLUDING OBSERVATIONS The
- Page 147 and 148: C HAPTER VII C ONCLUSIONS AND I MPL
- Page 149 and 150: noticeably low, and, among the very
- Page 151 and 152: Act. At the same time, some ENs hav
- Page 153 and 154: Another change requiring considerat
- Page 155 and 156: C HAPTER VIII N EXT S TEPS FOR THE
- Page 157 and 158: prior to September 2003 and had not
- Page 159 and 160: R EFERENCES Adequacy of Incentives
- Page 161 and 162: A PPENDIX A D ATA T ABLES C ORRESPO
- Page 163 and 164: A-3 Table A.2 Cumulative Number of
- Page 165 and 166: A-5 Table A.4 Percentage of Tickets
- Page 167 and 168: A-7 Table A.6 Percentage of Tickets
- Page 169: A-9 TABLES SHOWING CHARACTERISTICS
- Page 173 and 174: A-13 Table A.12 Ticket Participatio
- Page 175 and 176: A-15 Table A.14 Percentage of In-Us
- Page 177 and 178: A PPENDIX B P ROVIDER-SPECIFIC C AS
- Page 179 and 180: informed beneficiaries that state V
- Page 181 and 182: e considerably more successful if S
- Page 183 and 184: them for employment. It was during
- Page 185 and 186: working but are still receiving SSI
- Page 187 and 188: B.11 client over a four-year period
- Page 189 and 190: B.13 placing SSA beneficiaries than
- Page 191 and 192: B.15 that came in for an initial ap
- Page 193 and 194: B.17 all benefits; therefore, EES d
- Page 195 and 196: B.19 outreach program. As noted pre
- Page 197 and 198: B.21 remained employed. 3 Because o
- Page 199 and 200: B.23 estimate of the financial loss
- Page 201 and 202: B.25 Social Security benefits. IDR
- Page 203 and 204: B.27 have to submit pay stubs twice
- Page 205 and 206: B.29 Bridges still provides the 10-
- Page 207 and 208: B.31 While she used to have a polic
- Page 209 and 210: B.33 8. Oklahoma Department of Reha
- Page 211 and 212: B.35 Beneficiaries interested in as
- Page 213 and 214: B.37 permits agency budgets to be c
- Page 215 and 216: A PPENDIX C D EFINING THE F OUR A D
- Page 217 and 218: B. IDENTIFYING INDIVIDUALS WITH A N
- Page 219: “work and receive full cash benef