- Page 1 and 2:
National Science and Technology Cou
- Page 3 and 4:
WTEC Panel on NANOSTRUCTURE SCIENCE
- Page 5 and 6:
ABSTRACT This report reviews the st
- Page 7 and 8:
Foreword Timely information on scie
- Page 9 and 10:
Foreword iii collaboration and thus
- Page 11 and 12:
Contents Foreword Table of Contents
- Page 13 and 14:
List of Figures 1.1 Organization of
- Page 15 and 16:
List of Figures ix 5.12 Granular GM
- Page 17 and 18:
List of Tables ES.1 Technological I
- Page 19 and 20:
Executive Summary Richard W. Siegel
- Page 21 and 22:
Executive Summary xix past decade,
- Page 23 and 24:
Executive Summary xxi TABLE ES.2. C
- Page 25 and 26:
Executive Summary xxiii blocks, and
- Page 27 and 28:
Chapter 1 Introduction and Overview
- Page 29 and 30:
1. Introduction and Overview 3 •
- Page 31 and 32:
1. Introduction and Overview 5 worl
- Page 33 and 34:
1. Introduction and Overview 7 grow
- Page 35 and 36:
1. Introduction and Overview 9 lead
- Page 37 and 38:
1. Introduction and Overview 11 2.
- Page 39 and 40:
1. Introduction and Overview 13 It
- Page 41 and 42:
Chapter 2 Synthesis and Assembly Ev
- Page 43 and 44:
2. Synthesis and Assembly 17 transi
- Page 45 and 46:
2. Synthesis and Assembly 19 probe
- Page 47 and 48:
2. Synthesis and Assembly 21 by adj
- Page 49 and 50:
2. Synthesis and Assembly 23 blocks
- Page 51 and 52:
2. Synthesis and Assembly 25 Self-A
- Page 53 and 54:
2. Synthesis and Assembly 27 Figure
- Page 55 and 56:
2. Synthesis and Assembly 29 us to
- Page 57 and 58:
2. Synthesis and Assembly 31 Brotzm
- Page 59 and 60:
2. Synthesis and Assembly 33 Siegel
- Page 61 and 62:
Chapter 3 Dispersions and Coatings
- Page 63 and 64:
3. Dispersions and Coatings 37 exis
- Page 65 and 66:
3. Dispersions and Coatings 39 more
- Page 67 and 68:
3. Dispersions and Coatings 41 into
- Page 69 and 70:
3. Dispersions and Coatings 43 of N
- Page 71 and 72:
3. Dispersions and Coatings 45 oppo
- Page 73 and 74:
3. Dispersions and Coatings 47 Kanz
- Page 75 and 76:
Chapter 4 High Surface Area Materia
- Page 77 and 78:
4. High Surface Area Materials 51 w
- Page 79 and 80:
4. High Surface Area Materials 53 F
- Page 81 and 82:
4. High Surface Area Materials 55 T
- Page 83 and 84:
4. High Surface Area Materials 57 s
- Page 85 and 86:
4. High Surface Area Materials 59 T
- Page 87 and 88:
4. High Surface Area Materials 61 F
- Page 89 and 90:
4. High Surface Area Materials 63 m
- Page 91 and 92:
4. High Surface Area Materials 65 I
- Page 93 and 94:
Chapter 5 Functional Nanoscale Devi
- Page 95 and 96:
5. Functional Nanoscale Devices 69
- Page 97 and 98:
5. Functional Nanoscale Devices 71
- Page 99 and 100:
5. Functional Nanoscale Devices 73
- Page 101 and 102:
5. Functional Nanoscale Devices 75
- Page 103 and 104:
5. Functional Nanoscale Devices 77
- Page 105 and 106:
5. Functional Nanoscale Devices 79
- Page 107 and 108:
5. Functional Nanoscale Devices 81
- Page 109 and 110:
5. Functional Nanoscale Devices 83
- Page 111 and 112:
5. Functional Nanoscale Devices 85
- Page 113 and 114:
5. Functional Nanoscale Devices 87
- Page 115 and 116:
5. Functional Nanoscale Devices 89
- Page 117 and 118:
5. Functional Nanoscale Devices 91
- Page 119 and 120:
Chapter 6 Bulk Behavior of Nanostru
- Page 121 and 122:
6. Bulk Behavior of Nanostructured
- Page 123 and 124:
6. Bulk Behavior of Nanostructured
- Page 125 and 126:
6. Bulk Behavior of Nanostructured
- Page 127 and 128:
6. Bulk Behavior of Nanostructured
- Page 129 and 130:
6. Bulk Behavior of Nanostructured
- Page 131 and 132:
6. Bulk Behavior of Nanostructured
- Page 133 and 134:
6. Bulk Behavior of Nanostructured
- Page 135 and 136:
6. Bulk Behavior of Nanostructured
- Page 137 and 138:
6. Bulk Behavior of Nanostructured
- Page 139 and 140:
Chapter 7 Biologically Related Aspe
- Page 141 and 142:
7. Biologically Related Aspects of
- Page 143 and 144:
7. Biologically Related Aspects of
- Page 145 and 146:
7. Biologically Related Aspects of
- Page 147 and 148:
7. Biologically Related Aspects of
- Page 149 and 150:
7. Biologically Related Aspects of
- Page 151 and 152:
7. Biologically Related Aspects of
- Page 153 and 154:
7. Biologically Related Aspects of
- Page 155 and 156:
7. Biologically Related Aspects of
- Page 157 and 158:
Chapter 8 Research Programs on Nano
- Page 159 and 160:
8. Research Programs on Nanotechnol
- Page 161 and 162:
8. Research Programs on Nanotechnol
- Page 163 and 164:
8. Research Programs on Nanotechnol
- Page 165 and 166:
8. Research Programs on Nanotechnol
- Page 167 and 168:
8. Research Programs on Nanotechnol
- Page 169 and 170:
8. Research Programs on Nanotechnol
- Page 171 and 172:
8. Research Programs on Nanotechnol
- Page 173 and 174:
8. Research Programs on Nanotechnol
- Page 175 and 176:
8. Research Programs on Nanotechnol
- Page 177 and 178:
APPENDICES Appendix A. Biographies
- Page 179 and 180:
Appendix A. Biographies of Panelist
- Page 181 and 182:
Appendix A. Biographies of Panelist
- Page 183 and 184:
Appendix A. Biographies of Panelist
- Page 185 and 186:
Appendix B. Site Reports—Europe S
- Page 187 and 188:
Appendix B. Site Reports—Europe 1
- Page 189 and 190:
Appendix B. Site Reports—Europe 1
- Page 191 and 192:
Appendix B. Site Reports—Europe 1
- Page 193 and 194:
Appendix B. Site Reports—Europe 1
- Page 195 and 196:
Appendix B. Site Reports—Europe 1
- Page 197 and 198:
Appendix B. Site Reports—Europe 1
- Page 199 and 200:
Appendix B. Site Reports—Europe 1
- Page 201 and 202:
Appendix B. Site Reports—Europe 1
- Page 203 and 204:
Appendix B. Site Reports—Europe 1
- Page 205 and 206:
Appendix B. Site Reports—Europe 1
- Page 207 and 208:
Appendix B. Site Reports—Europe 1
- Page 209 and 210:
Appendix B. Site Reports—Europe 1
- Page 211 and 212:
Appendix B. Site Reports—Europe 1
- Page 213 and 214:
Appendix B. Site Reports—Europe 1
- Page 215 and 216:
Appendix B. Site Reports—Europe 1
- Page 217 and 218:
Appendix B. Site Reports—Europe 1
- Page 219 and 220:
Appendix B. Site Reports—Europe 1
- Page 221 and 222:
Appendix B. Site Reports—Europe 1
- Page 223 and 224:
Appendix B. Site Reports—Europe 1
- Page 225 and 226:
Appendix B. Site Reports—Europe 1
- Page 227 and 228:
Appendix B. Site Reports—Europe 2
- Page 229 and 230:
Appendix B. Site Reports—Europe 2
- Page 231 and 232:
Appendix B. Site Reports—Europe 2
- Page 233 and 234:
Appendix B. Site Reports—Europe 2
- Page 235 and 236:
Appendix B. Site Reports—Europe 2
- Page 237 and 238:
Appendix B. Site Reports—Europe 2
- Page 239 and 240:
Appendix B. Site Reports—Europe 2
- Page 241 and 242:
Appendix B. Site Reports—Europe 2
- Page 243 and 244:
Appendix B. Site Reports—Europe 2
- Page 245 and 246:
Appendix B. Site Reports—Europe 2
- Page 247 and 248:
Appendix C. European Roundtable Dis
- Page 249 and 250:
Appendix C. European Roundtable Dis
- Page 251 and 252:
Appendix C. European Roundtable Dis
- Page 253 and 254:
Appendix C. European Roundtable Dis
- Page 255 and 256:
Appendix C. European Roundtable Dis
- Page 257 and 258:
Appendix C. European Roundtable Dis
- Page 259 and 260:
Appendix C. European Roundtable Dis
- Page 261 and 262: Appendix C. European Roundtable Dis
- Page 263 and 264: Appendix C. European Roundtable Dis
- Page 265 and 266: Appendix C. European Roundtable Dis
- Page 267 and 268: Appendix C. European Roundtable Dis
- Page 269 and 270: Appendix D. Site Reports—Japan OV
- Page 271 and 272: Appendix D. Site Reports—Japan 24
- Page 273 and 274: Appendix D. Site Reports—Japan 24
- Page 275 and 276: Appendix D. Site Reports—Japan 24
- Page 277 and 278: Appendix D. Site Reports—Japan 25
- Page 279 and 280: Appendix D. Site Reports—Japan 25
- Page 281 and 282: Appendix D. Site Reports—Japan 25
- Page 283 and 284: Appendix D. Site Reports—Japan 25
- Page 285 and 286: Appendix D. Site Reports—Japan 25
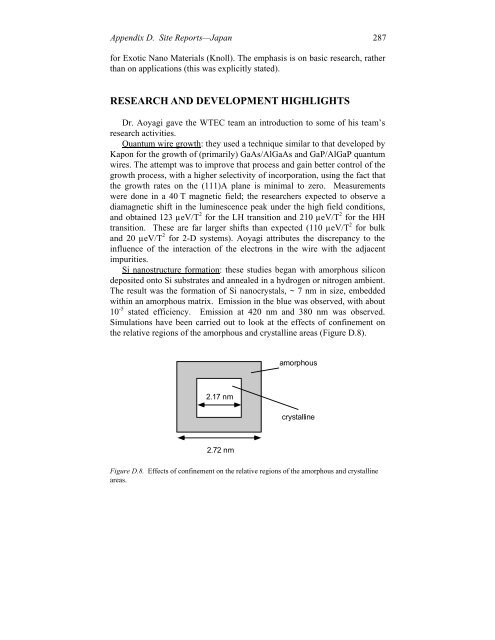
- Page 287 and 288: Appendix D. Site Reports—Japan 26
- Page 289 and 290: Appendix D. Site Reports—Japan 26
- Page 291 and 292: Appendix D. Site Reports—Japan 26
- Page 293 and 294: Appendix D. Site Reports—Japan 26
- Page 295 and 296: Appendix D. Site Reports—Japan 26
- Page 297 and 298: Appendix D. Site Reports—Japan 27
- Page 299 and 300: Appendix D. Site Reports—Japan 27
- Page 301 and 302: Appendix D. Site Reports—Japan 27
- Page 303 and 304: Appendix D. Site Reports—Japan 27
- Page 305 and 306: Appendix D. Site Reports—Japan 27
- Page 307 and 308: Appendix D. Site Reports—Japan 28
- Page 309 and 310: Appendix D. Site Reports—Japan 28
- Page 311: Appendix D. Site Reports—Japan 28
- Page 315 and 316: Appendix D. Site Reports—Japan 28
- Page 317 and 318: Appendix D. Site Reports—Japan 29
- Page 319 and 320: Appendix D. Site Reports—Japan 29
- Page 321 and 322: Appendix D. Site Reports—Japan 29
- Page 323 and 324: Appendix D. Site Reports—Japan 29
- Page 325 and 326: Appendix D. Site Reports—Japan 29
- Page 327 and 328: Appendix D. Site Reports—Japan 30
- Page 329 and 330: Appendix D. Site Reports—Japan 30
- Page 331 and 332: Appendix D. Site Reports—Japan 30
- Page 333 and 334: Appendix D. Site Reports—Japan 30
- Page 335 and 336: Appendix D. Site Reports—Japan 30
- Page 337 and 338: Appendix D. Site Reports—Japan 31
- Page 339 and 340: Appendix E. Site Reports—Taiwan O
- Page 341 and 342: Appendix E. Site Reports—Taiwan 3
- Page 343 and 344: Appendix E. Site Reports—Taiwan 3
- Page 345 and 346: Appendix E. Site Reports—Taiwan 3
- Page 347 and 348: Appendix E. Site Reports—Taiwan 3
- Page 349 and 350: Appendix E. Site Reports—Taiwan 3
- Page 351 and 352: Appendix E. Site Reports—Taiwan 3
- Page 353 and 354: Appendix F. Glossary 2DEG A/D AAAR
- Page 355 and 356: Appendix F. Glossary 329 ESPRIT ESR
- Page 357 and 358: Appendix F. Glossary 331 MA MBE mCP
- Page 359 and 360: Appendix F. Glossary 333 PVDF QCA Q
- Page 361 and 362: Appendix F. Glossary 335 WTEC XAS X