- Page 2 and 3:
Annona species Authors : A. C. de Q
- Page 4 and 5:
DFID/FRP and DISCLAIMERS This publi
- Page 6 and 7:
Table of Contents Abbreviations ...
- Page 8 and 9:
11.5 Processing....................
- Page 10 and 11:
10-9. A guide for phosphorus fertil
- Page 12 and 13:
12-1. Commercialization channels fo
- Page 14 and 15:
Acknowledgement Acknowledgements An
- Page 16 and 17:
Preface Increasing demand for exoti
- Page 18 and 19:
Chapter 1. Introduction A. C. de Q.
- Page 20 and 21:
Chapter 2. Taxonomy and Botany 2.1
- Page 22 and 23:
Chapter 2. Taxonomy and Botany Bota
- Page 24 and 25:
Chapter 2. Taxonomy and Botany the
- Page 26 and 27:
Chapter 2. Taxonomy and Botany Figu
- Page 28 and 29:
Chapter 2. Taxonomy and Botany tree
- Page 30 and 31:
Chapter 2. Taxonomy and Botany cont
- Page 32 and 33:
Chapter 2. Taxonomy and Botany 4. A
- Page 34 and 35:
Chapter 2. Taxonomy and Botany open
- Page 36 and 37:
Chapter 3. Origin and Distribution
- Page 38 and 39:
Chapter 3. Origin and Distribution
- Page 40 and 41:
Chapter 4. Major and Minor Producti
- Page 42 and 43:
Chapter 4. Major and Minor Producti
- Page 44 and 45:
Chapter 4. Major and Minor Producti
- Page 46 and 47:
Chapter 5. Ecological Factors Cheri
- Page 48 and 49:
Chapter 5. Ecological Factors frequ
- Page 50 and 51:
Chapter 5. Ecological Factors annon
- Page 52 and 53:
Chapter 6. Properties M. C. R. Cord
- Page 54 and 55:
Chapter 6. Properties 1997). The mo
- Page 56 and 57:
Chapter 6. Properties These compoun
- Page 58 and 59:
Chapter 7. Uses M. C. R. Cordeiro,
- Page 60 and 61:
Chapter 7. Uses (RH), before finall
- Page 62 and 63:
Chapter 7. Uses Seeds contain a red
- Page 64 and 65:
Chapter 7. Uses also be extracted f
- Page 66 and 67:
Chapter 8. Genetic Resources Table
- Page 68 and 69:
Chapter 8. Genetic Resources 8.3 Ex
- Page 70 and 71:
Chapter 8. Genetic Resources Table
- Page 72 and 73: Chapter 9. Genetic Improvement 9.1
- Page 74 and 75: Chapter 9. Genetic Improvement the
- Page 76 and 77: Chapter 9. Genetic Improvement a sh
- Page 78 and 79: Chapter 9. Genetic Improvement Bree
- Page 80 and 81: Chapter 9. Genetic Improvement cros
- Page 82 and 83: Chapter 9. Genetic Improvement In s
- Page 84 and 85: Chapter 9. Genetic Improvement Cult
- Page 86 and 87: Chapter 9. Genetic Improvement Shoo
- Page 88 and 89: Chapter 10. Agronomy 10.1 Propagati
- Page 90 and 91: Chapter 10. Agronomy GA is costly a
- Page 92 and 93: Chapter 10. Agronomy is about 1 m t
- Page 94 and 95: Chapter 10. Agronomy Figure 10-3. A
- Page 96 and 97: Chapter 10. Agronomy adult trees ro
- Page 98 and 99: Chapter 10. Agronomy Figure 10-4. S
- Page 100 and 101: Chapter 10. Agronomy methods (whip
- Page 102 and 103: Chapter 10. Agronomy 10.2 Field est
- Page 104 and 105: Plate 1. Purple skinned sugar apple
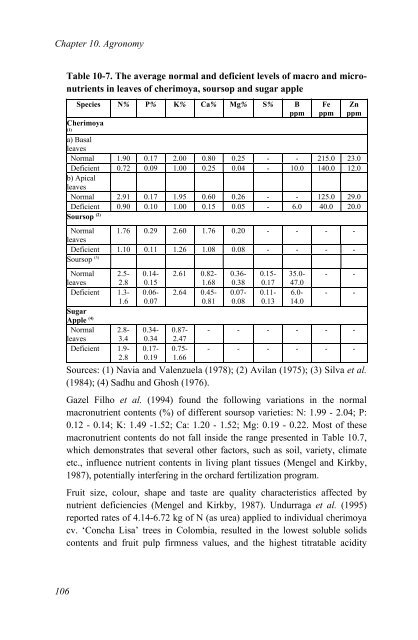
- Page 106 and 107: Chapter 10. Agronomy Plate 5. Small
- Page 108 and 109: Figure 10-8. Planting system accord
- Page 110 and 111: Chapter 10. Agronomy atemoya ‘Afr
- Page 112 and 113: Chapter 10. Agronomy approx. 120°
- Page 114 and 115: Chapter 10. Agronomy branches above
- Page 116 and 117: Chapter 10. Agronomy occurs in Janu
- Page 118 and 119: Chapter 10. Agronomy (1970) found t
- Page 120 and 121: Chapter 10. Agronomy (Grossberger,
- Page 124 and 125: Chapter 10. Agronomy values. This s
- Page 126 and 127: Chapter 10. Agronomy the apical lea
- Page 128 and 129: Chapter 10. Agronomy fertilization
- Page 130 and 131: Chapter 10. Agronomy quality. The f
- Page 132 and 133: Chapter 10. Agronomy Figure 10-13.
- Page 134 and 135: Chapter 10. Agronomy 10.3.7.1 Pests
- Page 136 and 137: Chapter 10. Agronomy control this p
- Page 138 and 139: Chapter 10. Agronomy cycle. Given t
- Page 140 and 141: Chapter 10. Agronomy Common Name Sp
- Page 142 and 143: Chapter 10. Agronomy Brown rot (Rhi
- Page 144 and 145: Chapter 11. Harvest, Postharvest an
- Page 146 and 147: Chapter 11. Harvest & Processing Co
- Page 148 and 149: Chapter 11. Harvest & Processing ne
- Page 150 and 151: Chapter 11. Harvest & Processing in
- Page 152 and 153: Chapter 11. Harvest & Processing de
- Page 154 and 155: Chapter 11. Harvest & Processing sc
- Page 156 and 157: Chapter 12. Economic Information A.
- Page 158 and 159: Chapter 12. Economic Information In
- Page 160 and 161: Chapter 12. Economic Information In
- Page 162 and 163: Chapter 12. Economic Information am
- Page 164 and 165: Chapter 12. Economic Information an
- Page 166 and 167: Chapter 12. Economic Information Pa
- Page 168 and 169: Chapter 13. Conclusions However, th
- Page 170 and 171: Chapter 13. Conclusions b) Better m
- Page 172 and 173:
Chapter 13. Conclusions b) Annona s
- Page 174 and 175:
References Aiyelaagbe I. O. O. (199
- Page 176 and 177:
References Beneto J. R., Rodriguez
- Page 178 and 179:
References Caparros-Lefebvre D., El
- Page 180 and 181:
References Cortés D., Myint S. H.,
- Page 182 and 183:
References Farooqi A. A., Parvatika
- Page 184 and 185:
References Fuster C. and Prestamo G
- Page 186 and 187:
References Hartmann H. T., Kester D
- Page 188 and 189:
References Idstein H., Herres W. an
- Page 190 and 191:
References Kosiyachinda S. and Youn
- Page 192 and 193:
References Lizana L. A. and Reginat
- Page 194 and 195:
References Moreno Andrade R., Luna
- Page 196 and 197:
References Nonfon M., Lieb F., Moes
- Page 198 and 199:
References Perfectti F. (1995) Estu
- Page 200 and 201:
References Popenoe W. (1974 b) “T
- Page 202 and 203:
References Saavedra E. (1977) “In
- Page 204 and 205:
References [Portuguese] In: Anais d
- Page 206 and 207:
References Viñas R. C. (1972) “A
- Page 208 and 209:
References Yu Jing-Guang, Gui Hua-Q
- Page 210 and 211:
Appendix A. Compounds References A.
- Page 212 and 213:
Appendix A. Compounds References A.
- Page 214 and 215:
Appendix A. Compounds References A.
- Page 216 and 217:
Appendix B. Appendix B. Human Bioac
- Page 218 and 219:
Appendix B. Appendix B. Human Bioac
- Page 220 and 221:
Appendix C. Institutions and Indivi
- Page 222 and 223:
Appendix C. 3740 Bilzen Belgium Agr
- Page 224 and 225:
Appendix C. Lemos, E. E.P. Departam
- Page 226 and 227:
Appendix C. Saavedra E. Faculdad de
- Page 228 and 229:
Appendix C. Cuba Cuba Payo A. Depar
- Page 230 and 231:
Appendix C. Ortega C. Instituto Nac
- Page 232 and 233:
Appendix C. Italy Parri G. Dipartim
- Page 234 and 235:
Appendix C. MÉXICO Abraján Herná
- Page 236 and 237:
Appendix C. Especialidad de Fruticu
- Page 238 and 239:
Appendix C. Cuernavaca, Morelos Mé
- Page 240 and 241:
Appendix C. PERÚ Duarte O. Departa
- Page 242 and 243:
Appendix C. Molecular, Universidad
- Page 244 and 245:
Appendix C. United Kingdom United K
- Page 246 and 247:
Appendix D. Countries and Instituti
- Page 248 and 249:
Appendix D. Taxon Sample Sample Typ
- Page 250 and 251:
Appendix D. Details of Holdings Tax
- Page 252 and 253:
Appendix D. ECUADOR 1. Centro Andin
- Page 254 and 255:
Appendix D. GERMANY Greenhouse for
- Page 256 and 257:
Appendix D. Details of Holdings Tax
- Page 258 and 259:
Appendix D. Lowlands Agriculture Ex
- Page 260 and 261:
Appendix D. PUERTO RICO Agricultura
- Page 262 and 263:
Appendix D. Taxon Sample Sample Typ
- Page 264 and 265:
Glossary A abcission - The normal s
- Page 266 and 267:
Glossary C caducous - falling off e
- Page 268 and 269:
Glossary epigynous - borne on or ar
- Page 270 and 271:
Glossary lanceolate - shaped like a
- Page 272 and 273:
Glossary pistil - the seed-bearing
- Page 274 and 275:
Glossary T tetraploid - having 4 se
- Page 276 and 277:
Index Chile, 4, 19, 23, 24, 26, 27,
- Page 278 and 279:
Index whip-and-tongue, 82, 83 Guana
- Page 280:
Index storage, 42, 44, 51, 107, 123