Annona Species Monograph.pdf - Crops for the Future
Annona Species Monograph.pdf - Crops for the Future
Annona Species Monograph.pdf - Crops for the Future

Create successful ePaper yourself
Turn your PDF publications into a flip-book with our unique Google optimized e-Paper software.
Chapter 12. Economic In<strong>for</strong>mation<br />
12.2), principally to <strong>the</strong> USA (70%), Japan (12%), Argentina (10%) and<br />
Brazil (5%) (Irazabal, 1997).<br />
Mexico produced more soursop than Brazil in <strong>the</strong> late 1990s, due both to its<br />
larger area and to its better productivity. Assuming that <strong>the</strong> Philippines has<br />
<strong>the</strong> same area of sugar apple in <strong>the</strong> year 2000 as it did in 1978 (2059 ha),<br />
Brazil had comparatively higher production due to its higher productivity<br />
(Table 12-2).<br />
Due to <strong>the</strong> niche markets of Asians and Latin Americans in <strong>the</strong> USA market,<br />
Thailand, <strong>the</strong> Dominican Republic and Costa Rica are becoming important<br />
cherimoya exporters to <strong>the</strong> USA (Crane and Campbell, 1990). Mexico with<br />
its numerous appropriate microclimate conditions, has a great potential to<br />
export cherimoya to USA and some growers have already thought of<br />
replacing <strong>the</strong>ir avocado orchards with cherimoya orchards (Agustin and<br />
Alviter, 1996), suggesting that <strong>the</strong> USA is still an important "open window"<br />
<strong>for</strong> cherimoya exporters.<br />
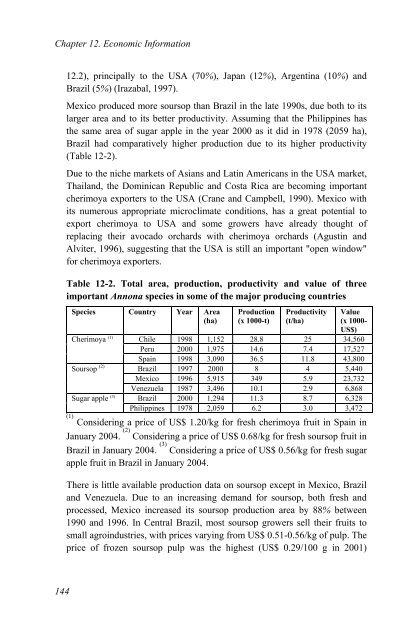
Table 12-2. Total area, production, productivity and value of three<br />
important <strong>Annona</strong> species in some of <strong>the</strong> major producing countries<br />
<strong>Species</strong> Country Year Area<br />
(ha)<br />
Production<br />
(x 1000-t)<br />
Productivity<br />
(t/ha)<br />
Value<br />
(x 1000-<br />
US$)<br />
Cherimoya (1) Chile 1998 1,152 28.8 25 34,560<br />
Peru 2000 1,975 14.6 7.4 17,527<br />
Spain 1998 3,090 36.5 11.8 43,800<br />
Soursop (2) Brazil 1997 2000 8 4 5,440<br />
Mexico 1996 5,915 349 5.9 23,732<br />
Venezuela 1987 3,496 10.1 2.9 6,868<br />
Sugar apple (3) Brazil 2000 1,294 11.3 8.7 6,328<br />
Philippines 1978 2,059 6.2 3.0 3,472<br />
(1)<br />
Considering a price of US$ 1.20/kg <strong>for</strong> fresh cherimoya fruit in Spain in<br />
January 2004. (2) Considering a price of US$ 0.68/kg <strong>for</strong> fresh soursop fruit in<br />
Brazil in January 2004. (3) Considering a price of US$ 0.56/kg <strong>for</strong> fresh sugar<br />
apple fruit in Brazil in January 2004.<br />
There is little available production data on soursop except in Mexico, Brazil<br />
and Venezuela. Due to an increasing demand <strong>for</strong> soursop, both fresh and<br />
processed, Mexico increased its soursop production area by 88% between<br />
1990 and 1996. In Central Brazil, most soursop growers sell <strong>the</strong>ir fruits to<br />
small agroindustries, with prices varying from US$ 0.51-0.56/kg of pulp. The<br />
price of frozen soursop pulp was <strong>the</strong> highest (US$ 0.29/100 g in 2001)<br />
144