Educational Finance in Thailand - UNESCO Bangkok
Educational Finance in Thailand - UNESCO Bangkok
Educational Finance in Thailand - UNESCO Bangkok
You also want an ePaper? Increase the reach of your titles
YUMPU automatically turns print PDFs into web optimized ePapers that Google loves.
2.11 In addition while the percentage of students cont<strong>in</strong>u<strong>in</strong>g to the next grade has always<br />
been fairly high (85-98 per cent) <strong>in</strong> the primary grades, the percentage of those<br />
cont<strong>in</strong>u<strong>in</strong>g on to secondary school after completion of the f<strong>in</strong>al primary grade drops<br />
dramatically to not more than 40-50 per cent, dur<strong>in</strong>g the last two decades. In 1990 this<br />
rate was 39 per cent for government schools and 60 per cent for private schools.<br />
2.12 The situation had steadily improved, with lower secondary enrollment ratio show<strong>in</strong>g<br />
a steady <strong>in</strong>crease, and register<strong>in</strong>g close to 70 per cent <strong>in</strong> 1993 (MOE, 1995). Moreover<br />
the latest figures (NEC, 1997) show that efforts to provide both formal and <strong>in</strong>formal<br />
programs for youths with primary education have produced some results. A<br />
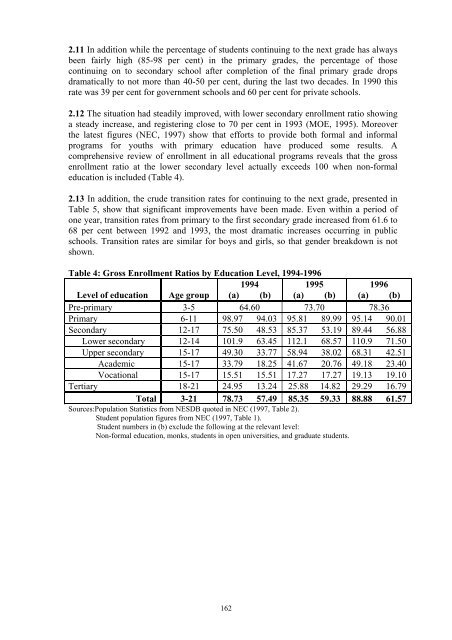
comprehensive review of enrollment <strong>in</strong> all educational programs reveals that the gross<br />
enrollment ratio at the lower secondary level actually exceeds 100 when non-formal<br />
education is <strong>in</strong>cluded (Table 4).<br />
2.13 In addition, the crude transition rates for cont<strong>in</strong>u<strong>in</strong>g to the next grade, presented <strong>in</strong><br />
Table 5, show that significant improvements have been made. Even with<strong>in</strong> a period of<br />
one year, transition rates from primary to the first secondary grade <strong>in</strong>creased from 61.6 to<br />
68 per cent between 1992 and 1993, the most dramatic <strong>in</strong>creases occurr<strong>in</strong>g <strong>in</strong> public<br />
schools. Transition rates are similar for boys and girls, so that gender breakdown is not<br />
shown.<br />
Table 4: Gross Enrollment Ratios by Education Level, 1994-1996<br />
1994<br />
1995<br />
1996<br />
Level of education Age group (a) (b) (a) (b) (a) (b)<br />
Pre-primary 3-5 64.60 73.70 78.36<br />
Primary 6-11 98.97 94.03 95.81 89.99 95.14 90.01<br />
Secondary 12-17 75.50 48.53 85.37 53.19 89.44 56.88<br />
Lower secondary 12-14 101.9 63.45 112.1 68.57 110.9 71.50<br />
Upper secondary 15-17 49.30 33.77 58.94 38.02 68.31 42.51<br />
Academic 15-17 33.79 18.25 41.67 20.76 49.18 23.40<br />
Vocational 15-17 15.51 15.51 17.27 17.27 19.13 19.10<br />
Tertiary 18-21 24.95 13.24 25.88 14.82 29.29 16.79<br />
Total 3-21 78.73 57.49 85.35 59.33 88.88 61.57<br />
Sources:Population Statistics from NESDB quoted <strong>in</strong> NEC (1997, Table 2).<br />
Student population figures from NEC (1997, Table 1).<br />
Student numbers <strong>in</strong> (b) exclude the follow<strong>in</strong>g at the relevant level:<br />
Non-formal education, monks, students <strong>in</strong> open universities, and graduate students.<br />
162


