Educational Finance in Thailand - UNESCO Bangkok
Educational Finance in Thailand - UNESCO Bangkok
Educational Finance in Thailand - UNESCO Bangkok

Create successful ePaper yourself
Turn your PDF publications into a flip-book with our unique Google optimized e-Paper software.
F<strong>in</strong>al Report, Volume II/3 Anthony. Cresswell: <strong>Educational</strong> <strong>F<strong>in</strong>ance</strong> <strong>UNESCO</strong>-PROAP TA 2996-THA<br />
Education Management and <strong>F<strong>in</strong>ance</strong> Study July 1999<br />
2.2.2.2. Expenditure Across Budget Categories<br />
a. Efficient use of resources requires a balance of allocation among the various<br />
uses and categories for the objects of expenditure. Therefore this review <strong>in</strong>cludes<br />
attention to the patterns <strong>in</strong> resource use over the recent past. The first part of this<br />
review exam<strong>in</strong>es the patterns of expenditure over the ma<strong>in</strong> categories of expense<br />
which are standard <strong>in</strong> the Government budget: salaries, temporary wages,<br />
remuneration (for non-salary expenses), utilities, subsidies (transfers to other<br />
levels or organizations), capital expenses, and other. The proportion of these<br />
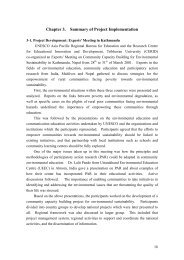
amounts by level are shown <strong>in</strong> Figure 12 below.<br />
Figure 12 - Per cent of budget by education level and category of expenditure<br />
Percent of Budget by Education Level and Categories of Expenditure, 1998<br />
Per Cent of Budget<br />
100%<br />
90%<br />
80%<br />
70%<br />
60%<br />
50%<br />
40%<br />
30%<br />
20%<br />
10%<br />
0%<br />
Pre-prim/Prim<br />
Secondary<br />
Academic<br />
Vocational<br />
Other<br />
Higher Educ.<br />
University<br />
Non-Degree<br />
Other<br />
Not def. by Level<br />
Not Classified<br />
Misc.<br />
TOTAL<br />
Salary Temp. Wages Remun. Utilities Capital Subsidies Other<br />
b. To show the actual scale of expenditure, the actual amounts and percentages<br />
allocated to these expenses for the 1998 budget are shown <strong>in</strong> Table 8 below.<br />
c. The comparison of amounts <strong>in</strong> Table 8 shows substantial variation <strong>in</strong> the mix of<br />
resources used <strong>in</strong> the different levels and components of the educational system.<br />
S<strong>in</strong>ce education is a labor-<strong>in</strong>tensive service, it is expected that the proportion of<br />
expenditure on salary and wages will be large. What is not expected is that the<br />
variation among the levels and components of the system would be as large as<br />
those seen here. Across almost all of primary and secondary components the<br />
proportion of temporary wages is similar. So the sizes of the differences are<br />
accounted for by permanent salaries. S<strong>in</strong>ce salary rates for the primary and perprimary<br />
grades are lower <strong>in</strong> general than those for secondary, the larger proportion<br />
of expense to salary for the lower levels must be accounted for by higher<br />
proportion of staff. The overall student-teacher ratios for the public schools bears<br />
this out, with an average of 23.3 students per teacher for the primary level,<br />
57