Educational Finance in Thailand - UNESCO Bangkok
Educational Finance in Thailand - UNESCO Bangkok
Educational Finance in Thailand - UNESCO Bangkok

Create successful ePaper yourself
Turn your PDF publications into a flip-book with our unique Google optimized e-Paper software.
F<strong>in</strong>al Report, Volume II/3 Anthony. Cresswell: <strong>Educational</strong> <strong>F<strong>in</strong>ance</strong> <strong>UNESCO</strong>-PROAP TA 2996-THA<br />
Education Management and <strong>F<strong>in</strong>ance</strong> Study July 1999<br />
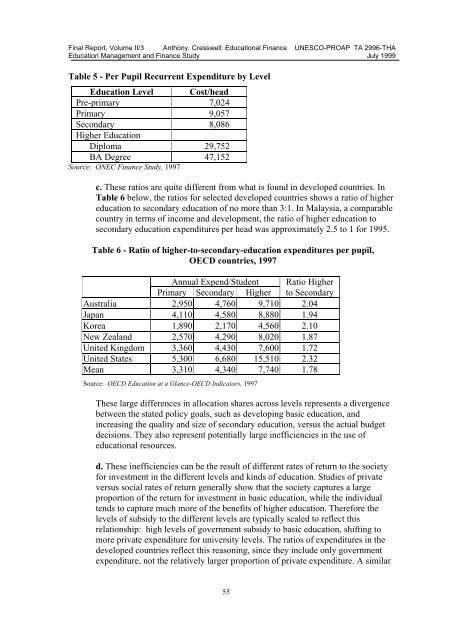
Table 5 - Per Pupil Recurrent Expenditure by Level<br />
Education Level Cost/head<br />
Pre-primary 7,024<br />
Primary 9,057<br />
Secondary 8,086<br />
Higher Education<br />
Diploma 29,752<br />
BA Degree 47,152<br />
Source: ONEC <strong>F<strong>in</strong>ance</strong> Study, 1997<br />
c. These ratios are quite different from what is found <strong>in</strong> developed countries. In<br />
Table 6 below, the ratios for selected developed countries shows a ratio of higher<br />
education to secondary education of no more than 3:1. In Malaysia, a comparable<br />
country <strong>in</strong> terms of <strong>in</strong>come and development, the ratio of higher education to<br />
secondary education expenditures per head was approximately 2.5 to 1 for 1995.<br />
Table 6 - Ratio of higher-to-secondary-education expenditures per pupil,<br />
OECD countries, 1997<br />
Annual Expend/Student Ratio Higher<br />
Primary Secondary Higher to Secondary<br />
Australia 2,950 4,760 9,710 2.04<br />
Japan 4,110 4,580 8,880 1.94<br />
Korea 1,890 2,170 4,560 2.10<br />
New Zealand 2,570 4,290 8,020 1.87<br />
United K<strong>in</strong>gdom 3,360 4,430 7,600 1.72<br />
United States 5,300 6,680 15,510 2.32<br />
Mean 3,310 4,340 7,740 1.78<br />
Source: OECD Education at a Glance-OECD Indicators, 1997<br />
These large differences <strong>in</strong> allocation shares across levels represents a divergence<br />
between the stated policy goals, such as develop<strong>in</strong>g basic education, and<br />
<strong>in</strong>creas<strong>in</strong>g the quality and size of secondary education, versus the actual budget<br />
decisions. They also represent potentially large <strong>in</strong>efficiencies <strong>in</strong> the use of<br />
educational resources.<br />
d. These <strong>in</strong>efficiencies can be the result of different rates of return to the society<br />
for <strong>in</strong>vestment <strong>in</strong> the different levels and k<strong>in</strong>ds of education. Studies of private<br />
versus social rates of return generally show that the society captures a large<br />
proportion of the return for <strong>in</strong>vestment <strong>in</strong> basic education, while the <strong>in</strong>dividual<br />
tends to capture much more of the benefits of higher education. Therefore the<br />
levels of subsidy to the different levels are typically scaled to reflect this<br />
relationship: high levels of government subsidy to basic education, shift<strong>in</strong>g to<br />
more private expenditure for university levels. The ratios of expenditures <strong>in</strong> the<br />
developed countries reflect this reason<strong>in</strong>g, s<strong>in</strong>ce they <strong>in</strong>clude only government<br />
expenditure, not the relatively larger proportion of private expenditure. A similar<br />
55