Educational Finance in Thailand - UNESCO Bangkok
Educational Finance in Thailand - UNESCO Bangkok
Educational Finance in Thailand - UNESCO Bangkok

Create successful ePaper yourself
Turn your PDF publications into a flip-book with our unique Google optimized e-Paper software.
F<strong>in</strong>al Report, Volume II/3 Anthony. Cresswell: <strong>Educational</strong> <strong>F<strong>in</strong>ance</strong> <strong>UNESCO</strong>-PROAP TA 2996-THA<br />
Education Management and <strong>F<strong>in</strong>ance</strong> Study July 1999<br />
c. A similar pattern of disproportionate expenditure burden is found when the<br />
impact is exam<strong>in</strong>ed by the family’s ma<strong>in</strong> occupation. The comparison of expenses<br />
as a proportion of <strong>in</strong>come for vary<strong>in</strong>g occupations is shown <strong>in</strong> Figure 16 below.<br />
The discrepancy between the highest and lowest <strong>in</strong>come groups by occupation is<br />
not as large as <strong>in</strong> the previous comparison (Figure 15). But the burden on the<br />
agricultural families, and to a lesser degree those <strong>in</strong> the <strong>in</strong>formal sector, is still<br />
significant. Even the cost of public education for agricultural families requires<br />
almost four times the percentage of <strong>in</strong>come compared to government and state<br />
employees.<br />
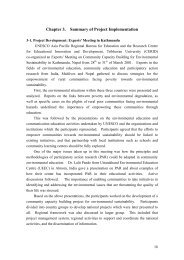
d. A similar pattern of <strong>in</strong>come-related burden is found <strong>in</strong> the results of the higher<br />
education survey. The respondents to that survey were asked to <strong>in</strong>dicate if their<br />
<strong>in</strong>come were sufficient to support higher education for their children. The answers<br />
to that question by <strong>in</strong>come group are shown <strong>in</strong> Figure 17 below. The pattern there<br />
is quite strik<strong>in</strong>g. Slightly over 70 per cent of the highest <strong>in</strong>come families reported<br />
that their <strong>in</strong>come was sufficient to support higher education for their children. For<br />
the lowest <strong>in</strong>come group, the comparable number was less than 5 per cent. Only <strong>in</strong><br />
the highest <strong>in</strong>come group did more than half of the families <strong>in</strong>dicate that they<br />
thought they had sufficient <strong>in</strong>come for these purposes. Of course whether the<br />
<strong>in</strong>come is sufficient requires a subjective judgment, and can vary a great deal from<br />
one family to another. And given the high levels of subsidy to higher education<br />
generally, this report<strong>in</strong>g of “<strong>in</strong>sufficient <strong>in</strong>come” <strong>in</strong> the upper <strong>in</strong>come groups is<br />
suspect. But the equity implications of the responses of the lowest <strong>in</strong>come groups<br />
do appear to be mean<strong>in</strong>gful and should be taken <strong>in</strong>to account <strong>in</strong> equity policy<br />
formulation.<br />
Figure 17 - Per cent of families with sufficient <strong>in</strong>come to support higher education<br />
Per Cent of Families with Sufficient Income to Support Higher<br />
Education<br />
Percent of Respondents<br />
100%<br />
90%<br />
80%<br />
70%<br />
60%<br />
50%<br />
40%<br />
30%<br />
20%<br />
10%<br />
0%<br />
< 3,000 3,000-<br />
6,000<br />
6,001-<br />
10,000<br />
10,001-<br />
20,000<br />
20,001-<br />
30,000<br />
over<br />
30,000<br />
Family Income (Baht per month)<br />
e. Overall these survey results clearly <strong>in</strong>dicate that even the poorest families are<br />
will<strong>in</strong>g to make major sacrifices to support their children’s education. The results<br />
also <strong>in</strong>dicate that the method of f<strong>in</strong>anc<strong>in</strong>g that relies on heavy private shar<strong>in</strong>g of<br />
68