Educational Finance in Thailand - UNESCO Bangkok
Educational Finance in Thailand - UNESCO Bangkok
Educational Finance in Thailand - UNESCO Bangkok

You also want an ePaper? Increase the reach of your titles
YUMPU automatically turns print PDFs into web optimized ePapers that Google loves.
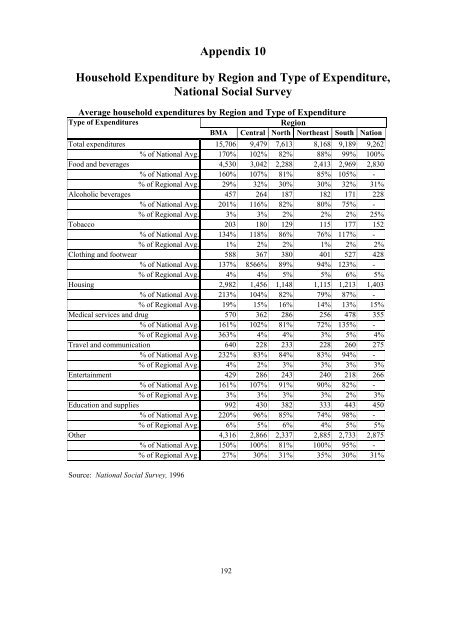
Appendix 10<br />
Household Expenditure by Region and Type of Expenditure,<br />
National Social Survey<br />
Average household expenditures by Region and Type of Expenditure<br />
Type of Expenditures<br />
Region<br />
BMA Central North Northeast South Nation<br />
Total expenditures 15,706 9,479 7,613 8,168 9,189 9,262<br />
% of National Avg. 170% 102% 82% 88% 99% 100%<br />
Food and beverages 4,530 3,042 2,288 2,413 2,969 2,830<br />
% of National Avg. 160% 107% 81% 85% 105% -<br />
% of Regional Avg. 29% 32% 30% 30% 32% 31%<br />
Alcoholic beverages 457 264 187 182 171 228<br />
% of National Avg. 201% 116% 82% 80% 75% -<br />
% of Regional Avg. 3% 3% 2% 2% 2% 25%<br />
Tobacco 203 180 129 115 177 152<br />
% of National Avg. 134% 118% 86% 76% 117% -<br />
% of Regional Avg. 1% 2% 2% 1% 2% 2%<br />
Cloth<strong>in</strong>g and footwear 588 367 380 401 527 428<br />
% of National Avg. 137% 8566% 89% 94% 123% -<br />
% of Regional Avg. 4% 4% 5% 5% 6% 5%<br />
Hous<strong>in</strong>g 2,982 1,456 1,148 1,115 1,213 1,403<br />
% of National Avg. 213% 104% 82% 79% 87% -<br />
% of Regional Avg. 19% 15% 16% 14% 13% 15%<br />
Medical services and drug 570 362 286 256 478 355<br />
% of National Avg. 161% 102% 81% 72% 135% -<br />
% of Regional Avg. 363% 4% 4% 3% 5% 4%<br />
Travel and communication 640 228 233 228 260 275<br />
% of National Avg. 232% 83% 84% 83% 94% -<br />
% of Regional Avg. 4% 2% 3% 3% 3% 3%<br />
Enterta<strong>in</strong>ment 429 286 243 240 218 266<br />
% of National Avg. 161% 107% 91% 90% 82% -<br />
% of Regional Avg. 3% 3% 3% 3% 2% 3%<br />
Education and supplies 992 430 382 333 443 450<br />
% of National Avg. 220% 96% 85% 74% 98% -<br />
% of Regional Avg. 6% 5% 6% 4% 5% 5%<br />
Other 4,316 2,866 2,337 2,885 2,733 2,875<br />
% of National Avg. 150% 100% 81% 100% 95% -<br />
% of Regional Avg. 27% 30% 31% 35% 30% 31%<br />
Source: National Social Survey, 1996<br />
192