

Download Full Issue in PDF - Academy Publisher
Download Full Issue in PDF - Academy Publisher
Download Full Issue in PDF - Academy Publisher

Create successful ePaper yourself
Turn your PDF publications into a flip-book with our unique Google optimized e-Paper software.
JOURNAL OF COMPUTERS, VOL. 8, NO. 6, JUNE 2013 1423<br />
and denote it as arr_<strong>in</strong>d={1, 4, 5}.<br />
Substep 10.5: Get the list <strong>in</strong>dexes (orig<strong>in</strong>al<br />
sequential ID <strong>in</strong> a list) of items “d” and “b” <strong>in</strong><br />
the list ProArr[1], which are 1 and 2<br />
respectively, and denote it as item_<strong>in</strong>d={1, 2}.<br />
Substep 10.6: Get the probability values of itemset<br />
{a} <strong>in</strong> ProArr[1] and ProArr[4] and ProArr[5]<br />
respectively, and denote them as bp={0.8, 0.9,<br />
0.95}; this is the correspond<strong>in</strong>g base<br />
probabilities <strong>in</strong> the sub tree subT.<br />
Substep 10.7: Add the sorted itemset {db} to subT;<br />
ma<strong>in</strong>ta<strong>in</strong> arr_<strong>in</strong>d, item_<strong>in</strong>d, bp and the length<br />
of the itemset {db} to the tail node <strong>in</strong> subT; the<br />
result is shown <strong>in</strong> Figure 3(c).<br />
Substep 10.8: Process the tree subT recursively, and<br />
get a new sub tree for the base-itemset {ab}, as<br />
shown <strong>in</strong> Figure 3(d). Lastly, get frequent<br />
itemsets {ab}, {abd} and {ad} when process<strong>in</strong>g<br />
the sub tree of itemset {a}.<br />
Step 11: Go on process<strong>in</strong>g the rema<strong>in</strong><strong>in</strong>g items <strong>in</strong> header<br />
table H.<br />
V. EXPERIMENTAL RESULTS<br />
In this section, we evaluate the performance of the<br />
proposed algorithm AT-M<strong>in</strong>e.<br />
Summariz<strong>in</strong>g the related works <strong>in</strong> Section 3, we can<br />
conclude that the algorithm MBP is the state-of-the-art<br />
algorithm employ<strong>in</strong>g the level-wise approach, UP-<br />
Growth is the state-of-the-art algorithm employ<strong>in</strong>g the<br />
pattern-growth approach and CUFP-M<strong>in</strong>e is a new<br />
proposed algorithm. So we compare AT-M<strong>in</strong>e with the<br />
algorithms UF-Growth, CUFP-M<strong>in</strong>e and MBP on both<br />
types of datasets: the sparse transaction datasets and<br />
dense transaction datasets. All algorithms were written <strong>in</strong><br />
Java programm<strong>in</strong>g language. The configuration of the<br />
test<strong>in</strong>g platform is as follows: W<strong>in</strong>dows XP operat<strong>in</strong>g<br />
system, 2G Memory, Intel(R) Core(TM) i3-2310 CPU @<br />
2.10 GHz; Java heap size is 1G.<br />
TABLE III.<br />
DATASET CHARACTERISTICS<br />
Dataset |D| |I| ML SD (%) Type<br />
T20I6D<br />
300K<br />
300,000 1000 20 2 sparse<br />
kosarak 990,002 41,271 8 0.02 sparse<br />
connect 67,557 129 43 33.33 dense<br />
mushroom 8,124 119 23 19.33 dense<br />
Table 3 shows the characteristics of 4 datasets used <strong>in</strong><br />
our experiments. “|D|” represents the total number of<br />
transactions; “|I|” represents the total number of dist<strong>in</strong>ct<br />
items; “ML” represents the mean length of all transaction<br />
itemsets; “SD” represents the degree of sparsity or<br />
density. The synthetic dataset T20I6D300K came from<br />
the IBM Data Generator [1] and the datasets kosarak,<br />
connect and mushroom were obta<strong>in</strong>ed from FIMI<br />
Repository [33]; These four datasets orig<strong>in</strong>ally do not<br />
provide probability values for each item of each<br />
transaction itemset; as suggested by literatures [23, 25, 28,<br />
29], we assign a existential probability of range (0, 1] to<br />
each item. The runnable programs and test<strong>in</strong>g datasets<br />
can be downloaded from the follow<strong>in</strong>g address:<br />
http://code.google.com/p/at-tree/downloads/list.<br />
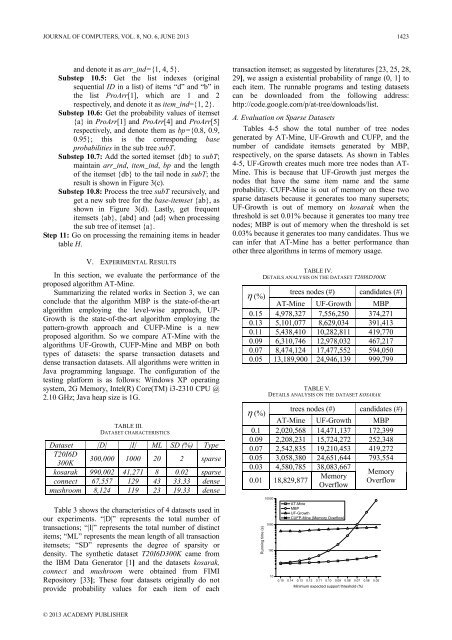
A. Evaluation on Sparse Datasets<br />
Tables 4-5 show the total number of tree nodes<br />
generated by AT-M<strong>in</strong>e, UF-Growth and CUFP, and the<br />
number of candidate itemsets generated by MBP,<br />
respectively, on the sparse datasets. As shown <strong>in</strong> Tables<br />
4-5, UF-Growth creates much more tree nodes than AT-<br />
M<strong>in</strong>e. This is because that UF-Growth just merges the<br />
nodes that have the same item name and the same<br />
probability. CUFP-M<strong>in</strong>e is out of memory on these two<br />
sparse datasets because it generates too many supersets;<br />
UF-Growth is out of memory on kosarak when the<br />
threshold is set 0.01% because it generates too many tree<br />
nodes; MBP is out of memory when the threshold is set<br />
0.03% because it generates too many candidates. Thus we<br />
can <strong>in</strong>fer that AT-M<strong>in</strong>e has a better performance than<br />
other three algorithms <strong>in</strong> terms of memory usage.<br />
TABLE IV.<br />
DETAILS ANALYSIS ON THE DATASET T20I6D300K<br />
η (%)<br />
trees nodes (#) candidates (#)<br />
AT-M<strong>in</strong>e UF-Growth MBP<br />
0.15 4,978,327 7,556,250 374,271<br />
0.13 5,101,077 8,629,034 391,413<br />
0.11 5,438,410 10,282,811 419,770<br />
0.09 6,310,746 12,978,032 467,217<br />
0.07 8,474,124 17,477,552 594,050<br />
0.05 13,189,900 24,946,139 999,799<br />
Runn<strong>in</strong>g time (s)<br />
TABLE V.<br />
DETAILS ANALYSIS ON THE DATASET KOSARAK<br />
η (%)<br />
trees nodes (#) candidates (#)<br />
AT-M<strong>in</strong>e UF-Growth MBP<br />
0.1 2,020,568 14,471,137 172,399<br />
0.09 2,208,231 15,724,272 252,348<br />
0.07 2,542,835 19,210,453 419,272<br />
0.05 3,058,380 24,651,644 793,554<br />
0.03 4,580,785 38,083,667<br />
0.01 18,829,877<br />
Memory<br />
Overflow<br />
Memory<br />
Overflow<br />
10000<br />
1000<br />
100<br />
AT-M<strong>in</strong>e<br />
MBP<br />
UF-Growth<br />
CUFP-M<strong>in</strong>e (Memory Overflow)<br />
10<br />
0.15 0.14 0.13 0.12 0.11 0.10 0.09 0.08 0.07 0.06 0.05<br />
M<strong>in</strong>imum expected support threshold (%)<br />
© 2013 ACADEMY PUBLISHER


