

Download Full Issue in PDF - Academy Publisher
Download Full Issue in PDF - Academy Publisher
Download Full Issue in PDF - Academy Publisher

Create successful ePaper yourself
Turn your PDF publications into a flip-book with our unique Google optimized e-Paper software.
1380 JOURNAL OF COMPUTERS, VOL. 8, NO. 6, JUNE 2013<br />
neurons[31]. Excitatory neurons are pyramidal cells <strong>in</strong><br />
morphology. The fir<strong>in</strong>g characteristics of excitatory<br />
neurons are regular spik<strong>in</strong>g (RS) neurons, which present<br />
rapid and evident fir<strong>in</strong>g frequency adaptation respond<strong>in</strong>g<br />
to a cont<strong>in</strong>uous depolariz<strong>in</strong>g current <strong>in</strong>jection. Inhibitory<br />
neurons are <strong>in</strong>terneuron cells. The fir<strong>in</strong>g characteristics of<br />
excitatory neurons are fast spik<strong>in</strong>g (FS) neurons, which<br />
respond to long depolariz<strong>in</strong>g current stimulus with higher<br />
fir<strong>in</strong>g rate and less prom<strong>in</strong>ent spike frequency adaptation<br />
than RS neurons.<br />
In our Spik<strong>in</strong>g neuronal network simulation of<br />
prefrontal cortex, all HR neurons are coupled by<br />
functional connectivity. The equations of network model<br />
are shown as (8), (9), and (10):<br />
dX<br />
d<br />
N<br />
i<br />
3 2<br />
Yi aXi bXi Zi Istim<br />
w AijX<br />
j<br />
t j=<br />
1<br />
= − + − + + , (8)<br />
dYi<br />
dt<br />
= c−dX − Y , (9)<br />
2<br />
i<br />
dZi<br />
1<br />
= r( Xi<br />
− ( Zi<br />
- g))<br />
, (10)<br />
dt<br />
4<br />
where the subscript i represents the neuron number, N<br />
is the number of neurons. In our simulation we use<br />
N equals to the neuron number <strong>in</strong> work<strong>in</strong>g memory<br />
experiment <strong>in</strong> rat prefrontal cortex.<br />
i<br />
w<br />
N<br />
<br />
j=<br />
1<br />
A X<br />
ij<br />
j<br />
is the<br />
coupl<strong>in</strong>g term of the neural network model, where w is<br />
the coupl<strong>in</strong>g strength of connectivity from neuron j to<br />
neuron i . Aij<br />
is an N × N martix, which represents the<br />
coupl<strong>in</strong>g matrix of the neurons when a connection exists<br />
between neurons i and j .<br />
III. RESULTS<br />
A. Neural Ensemble Cod<strong>in</strong>g from Experimental Data<br />
After us<strong>in</strong>g software of spike sort<strong>in</strong>g (off-l<strong>in</strong>e sorter,<br />
Plexon, TX, USA) to separate s<strong>in</strong>gle neuron data from<br />
16-channel data, we obta<strong>in</strong> 34 neurons and correspond<strong>in</strong>g<br />
spike tra<strong>in</strong>s. Neuronal population spatiotemporal<br />
activities <strong>in</strong> rat prefrontal cortex dur<strong>in</strong>g the performance<br />
of work<strong>in</strong>g memory task <strong>in</strong> vivo are shown <strong>in</strong> Fig. 1.<br />
In Fig. 1, effective period of 7 seconds is selected to<br />
represent the whole work<strong>in</strong>g memory process. The<br />
dynamic entropy cod<strong>in</strong>g method was applied to<br />
characterize activity of neural population response to the<br />
work<strong>in</strong>g memory event. We calculated the entropy values<br />
of population fir<strong>in</strong>g dur<strong>in</strong>g work<strong>in</strong>g memory task. The<br />
neural fir<strong>in</strong>g entropy matrix is obta<strong>in</strong>ed <strong>in</strong> slid<strong>in</strong>g w<strong>in</strong>dow<br />
of 200 milliseconds with 50 milliseconds overlapp<strong>in</strong>g,<br />
represent<strong>in</strong>g the local entropy for each neuron. And<br />
neural ensemble entropy cod<strong>in</strong>g is shown <strong>in</strong> Fig. 2.<br />
Spike raster<br />
(neuron# 1-34)<br />
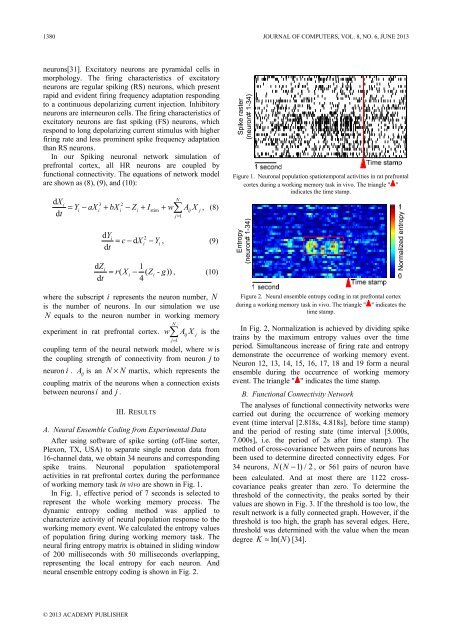
Figure 1. Neuronal population spatiotemporal activities <strong>in</strong> rat prefrontal<br />
cortex dur<strong>in</strong>g a work<strong>in</strong>g memory task <strong>in</strong> vivo. The triangle " "<br />
<strong>in</strong>dicates the time stamp.<br />
Entropy<br />
(neuron# 1-34)<br />
Normalized entropy<br />
Figure 2. Neural ensemble entropy cod<strong>in</strong>g <strong>in</strong> rat prefrontal cortex<br />
dur<strong>in</strong>g a work<strong>in</strong>g memory task <strong>in</strong> vivo. The triangle " " <strong>in</strong>dicates the<br />
time stamp.<br />
In Fig. 2, Normalization is achieved by divid<strong>in</strong>g spike<br />
tra<strong>in</strong>s by the maximum entropy values over the time<br />
period. Simultaneous <strong>in</strong>crease of fir<strong>in</strong>g rate and entropy<br />
demonstrate the occurrence of work<strong>in</strong>g memory event.<br />
Neuron 12, 13, 14, 15, 16, 17, 18 and 19 form a neural<br />
ensemble dur<strong>in</strong>g the occurrence of work<strong>in</strong>g memory<br />
event. The triangle " " <strong>in</strong>dicates the time stamp.<br />
B. Functional Connectivity Network<br />
The analyses of functional connectivity networks were<br />
carried out dur<strong>in</strong>g the occurrence of work<strong>in</strong>g memory<br />
event (time <strong>in</strong>terval [2.818s, 4.818s], before time stamp)<br />
and the period of rest<strong>in</strong>g state (time <strong>in</strong>terval [5.000s,<br />
7.000s], i.e. the period of 2s after time stamp). The<br />
method of cross-covariance between pairs of neurons has<br />
been used to determ<strong>in</strong>e directed connectivity edges. For<br />
34 neurons, N( N − 1)/2, or 561 pairs of neuron have<br />
been calculated. And at most there are 1122 crosscovariance<br />
peaks greater than zero. To determ<strong>in</strong>e the<br />
threshold of the connectivity, the peaks sorted by their<br />
values are shown <strong>in</strong> Fig. 3. If the threshold is too low, the<br />
result network is a fully connected graph. However, if the<br />
threshold is too high, the graph has several edges. Here,<br />
threshold was determ<strong>in</strong>ed with the value when the mean<br />
degree K ≈ ln( N)<br />
[34].<br />
© 2013 ACADEMY PUBLISHER


