Chapter A General rules of electrical installation design
Chapter A General rules of electrical installation design
Chapter A General rules of electrical installation design

Create successful ePaper yourself
Turn your PDF publications into a flip-book with our unique Google optimized e-Paper software.
© Schneider Electric - all rights reserved<br />
K<br />
K - Energy Efficiency in <strong>electrical</strong> distribution<br />
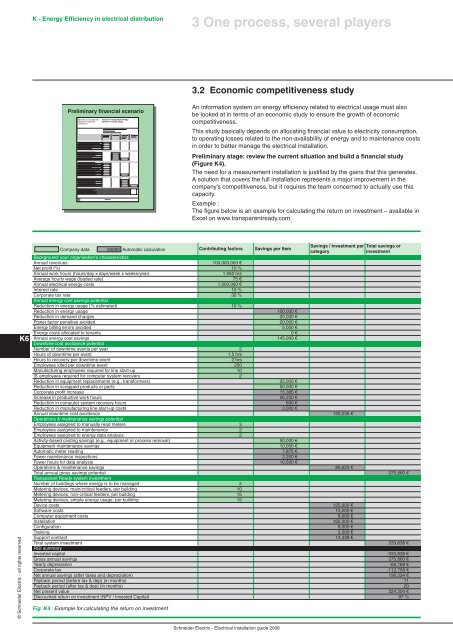
3.2 Economic competitiveness study<br />
Company data 00000 Automatic calculation Contributing factors Savings per Item<br />
Fig. K4 : Example for calculating the return on investment<br />
3 One process, several players<br />
An information system on energy efficiency related to <strong>electrical</strong> usage must also<br />
be looked at in terms <strong>of</strong> an economic study to ensure the growth <strong>of</strong> economic<br />
competitiveness.<br />
This study basically depends on allocating financial value to electricity consumption,<br />
to operating losses related to the non-availability <strong>of</strong> energy and to maintenance costs<br />
in order to better manage the <strong>electrical</strong> <strong>installation</strong>.<br />
Preliminary stage: review the current situation and build a financial study<br />
(Figure K4).<br />
The need for a measurement <strong>installation</strong> is justified by the gains that this generates.<br />
A solution that covers the full <strong>installation</strong> represents a major improvement in the<br />
company’s competitiveness, but it requires the team concerned to actually use this<br />
capacity.<br />
Example :<br />
The figure below is an example for calculating the return on investment – available in<br />
Excel on www.transparentready.com.<br />
Schneider Electric - Electrical <strong>installation</strong> guide 2008<br />
Savings / Investment per<br />
category<br />
Total savings or<br />
investment<br />
Background: your organisation’s characteristics<br />
Annual revenues 100,000,000<br />
Net pr<strong>of</strong>it (%) 10 %<br />
Annual work hours (hours/day x days/week x weeks/year) 1.950 hrs<br />
Average hourly wage (loaded rate) 75<br />
Annual <strong>electrical</strong> energy costs 1,000,000<br />
Interest rate 15 %<br />
Corporate tax rate 30 %<br />
Annual energy cost savings potential<br />
Reduction in energy usage (% estimated) 10 %<br />
Reduction in energy usage 100,000<br />
Reduction in demand charges 20,000<br />
Power factor penalties avoided 20,000<br />
Energy billing errors avoided 5,000<br />
Energy costs allocated to tenants 0<br />
Annual energy cost savings 145,000<br />
Downtime cost avoidance potential<br />
Number <strong>of</strong> downtime events per year 2<br />
Hours <strong>of</strong> downtime per event 1.5 hrs<br />
Hours to recovery per downtime event 2 hrs<br />
Employees idled per downtime event 250<br />
Manufacturing employees required for line start-up 10<br />
IS employees required for computer system recovery 2<br />
Reduction in equipment replacements (e.g., transformers) 25,000<br />
Reduction in scrapped products or parts 50,000<br />
Corporate pr<strong>of</strong>it increase 15,385<br />
Increase in productive work hours 56,250<br />
Reduction in computer system recovery hours 600<br />
Reduction in manufacturing line start-up costs 3,000<br />
Annual downtime cost avoidance 150,235<br />
Operations & maintenance savings potential<br />
Employees assigned to manually read meters 3<br />
Employees assigned to maintenance 2<br />
Employees assigned to energy data analysis 2<br />
Activity-based costing savings (e.g., equipment or process removal) 50,000<br />
Equipment maintenance savings 10,000<br />
Automatic meter reading 7,875<br />
Fewer maintenance inspections 2,250<br />
Fewer hours for data analysis 10,500<br />
Operations & maintenance savings 80,625<br />
Total annual gross savings potential 375,860<br />
Transparent Ready system investment<br />
Number <strong>of</strong> buildings where energy is to be managed 2<br />
Metering devices, main/critical feeders, per building 10<br />
Metering devices, non-critical feeders, per building 15<br />
Metering devices, simple energy usage, per building 15<br />
Device costs 125,000<br />
S<strong>of</strong>tware costs 15,000<br />
Computer equipment costs 8,000<br />
Installation 160,000<br />
Configuration 8,000<br />
Training 3,500<br />
Support contract 14,338<br />
Total system investment 333,838<br />
ROI summary<br />
Invested capital -333,838<br />
Gross annual savings 375,860<br />
Yearly depreciation -66,768<br />
Corporate tax -112,758<br />
Net annual savings (after taxes and depreciation) 196,334<br />
Payback period (before tax & dep) (in months) 11<br />
Payback period (after tax & dep) (in months) 20<br />
Net present value 324,304<br />
Discounted return on investment (NPV / Invested Capital) 97 %