Poster Session, Thursday, June 17Theme F686 - N1123Humidity Sensor applications based on Carbon Nanotubes (CNTs) modified with various Calixarenemolecules measured by a Quartz Crystal Microbalance (QCM)F. Nadi Gür 1* , S. Okur 1* , Nesli T. Yağmurcukardeş 1 , Mustafa Yılmaz 2 , Mahmut Kuş 31 Izmir Institute of Technology, Department of Physics Urla/Izmir/TURKEY2 Selçuk University, Department of Chemistry, Selçuklu/Konya/TURKEY3 Selçuk University, Department of Chemical Eng<strong>in</strong>eer<strong>in</strong>g, Selçuklu/Konya/TURKEYAbstract— We predict that CNTs modified with calixerene molecules has a strong potential to <strong>in</strong>vestigate as a humiditysensors. This study focuses on humidity sens<strong>in</strong>g properties of CNTs modified with calixrene. The humidity adsorbtiondesorptionk<strong>in</strong>etics are tested by Quartz Crystal Microbalance (QCM) technique. Accord<strong>in</strong>g to the our experimental results,modified CNTs with calixerene film will be possible option and open new approaches for more reliable, high sensitive,reversible and cost effective electro-chemical sensor applications.The accurate measurements of humidity levels are veryimportant concerns <strong>in</strong> environmental fields, such as medical ordomestic applications for human comfort, <strong>in</strong>dustrial uses,agriculture, automobiles.Thus, the requirement for cheap,reliable and sensitive sensors are urgent.Across all over the world, researchers have been<strong>in</strong>terested <strong>in</strong> CNT based sensors and CNTs have shown to bestrong potential for the revolutionary of sensors generations[1]. As can be seen from Fig.1, due to their small size, highstrength, high electrical and thermal conductivity, and largeeffective active area, CNTs have many advantages compare tothe bulk or th<strong>in</strong> films for electro-chemical sensor applications[1,2].repeatability characteristics. The adsorption-desorptionk<strong>in</strong>etics are analyzed and discussed <strong>in</strong> details. F (Hz)50%110 %22 (a)%43-50 %53-100-150%75%84%94 %94%75%84%11%22%43%53-200%97-2500 1000 2000 3000 4000 5000 6000Time (s)- F (Hz)1000100 F (Hz)500-50-100-150-200(b)%43%53%75%84%97-2500 200 400 600 800 1000 1200Time (s)y = 13.733 * e^(0.028238x) R= 0.99383y = 8.1544 * e^(0.034337x) R= 0.98145(c)downwardupwardFigure 1: SEM image of carbon nanotubes filmTh<strong>in</strong> films of calixarene derivatives have been widely used<strong>in</strong> chemical sensors. Due to their zeolite-like capacity andselectivity, calixarenes became promis<strong>in</strong>g materials for sensorapplications [3]. Calixarene derivatives have been used <strong>in</strong>recent times as gas sensors applications [4]. It is also knownthat some calixarene derivatives adsorb water molecules. SalihOkur reported a humidity sens<strong>in</strong>g properties of calixerenederivatives [5]. However we did not reach any application ofCNTs modified with calixerene molecules based on humiditysensor.QCM tehnique is a powerfull option to <strong>in</strong>vestigate sens<strong>in</strong>gproperties of modified CNTs, s<strong>in</strong>ce it is highly sensitive tomass changes 1 ng/ 2 [2]. QCM has been used widely tomonitor the change <strong>in</strong> mass load<strong>in</strong>g by measur<strong>in</strong>g the shift ofits resonant frequency [5].In this work, we firstly started with CNTs dissolved <strong>in</strong>toethanol and CNT film coated by drop-cast<strong>in</strong>g technique.Humidity measurements of CNT film were recorded andmonitored by QCM from %11 RH to %97 RH. Accord<strong>in</strong>g toFig.2 adsorbtion-desorbtion process are very fast andreversible. We have obta<strong>in</strong>ed very good response and high1020 30 40 50 60 70 80 90 100Relative Humidity (%)Figure 2: QCM frequency shifts (Hz) as a function of time (s) for different<strong>in</strong>creas<strong>in</strong>g and decreas<strong>in</strong>g relative humidity values between 11% and 97% RH(a) and (b) The change <strong>in</strong> the QCM frequency vs vary<strong>in</strong>g RH values (c)In summary, both CNTs and Calixerene derivates show verygood response to humidity changes sensor applications.Modified CNTs with Calixerene molecules show highlysensitive responce to RH changes and can be used as costeffective sensor materials.*Correspond<strong>in</strong>g author: salihokur@iyte.edu.tr ,fatihnadigur@gmail.com[1] Niraj S<strong>in</strong>ha, Jiazhi Ma, and John T. W. Yeow, Carbon Nanotube-BasedSensors,JNN Vol.6, 573–590, 2006[2] Y. Zhang, K. Yu, R. Xu, D. Jiang, L. Luo, Z. Zhu, Quartz crystalmicrobalance coated with carbon nanotube films used as humidity sensor,Sens. Actuators A 120 (2005) 142–146.)[3] Koshets I. A., et.al.,Sens. Actuators B 106, (2005), 177[4] Ohira, Sh<strong>in</strong>-I. , et.al., Talanta 2009, 77, 1814.[5]Salih Okur, Mahmut Kus, Faruk Ozel, Mustafa Yılmaz,Humidityadsorption k<strong>in</strong>etics of water soluble calix[4]arene derivativesmeasured us<strong>in</strong>g QCM technique,Sensors and Actuators B 145 (2010) 93–976th Nanoscience and Nanotechnology Conference, zmir, 2010 699
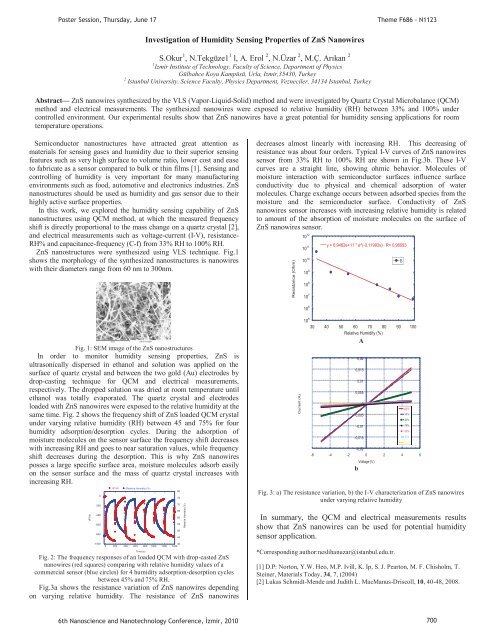
Poster Session, Thursday, June 17Theme F686 - N1123Investigation of Humidity Sens<strong>in</strong>g Properties of ZnS NanowiresS.Okur 1 , N.Tekgüze1 1 l, A. Erol 2 , N.Üzar 2 , M.Ç. Arıkan 21 Izmir Institute of Technology, Faculty of Science, Department of PhysicsGülbahce Koyu Kampüsü, Urla, Izmir,35430, Turkey2 Istanbul University, Science Faculty, Physics Department, Vezneciler, 34134 Istanbul, TurkeyAbstract— ZnS nanowires synthesized by the VLS (Vapor-Liquid-Solid) method and were <strong>in</strong>vestigated by Quartz Crystal Microbalance (QCM)method and electrical measurements. The synthesized nanowires were exposed to relative humidity (RH) between 33% and 100% undercontrolled environment. Our experimental results show that ZnS nanowires have a great potential for humidity sens<strong>in</strong>g applications for roomtemperature operations.Semiconductor nanostructures have attracted great attention asmaterials for sens<strong>in</strong>g gases and humidity due to their superior sens<strong>in</strong>gfeatures such as very high surface to volume ratio, lower cost and easeto fabricate as a sensor compared to bulk or th<strong>in</strong> films [1]. Sens<strong>in</strong>g andcontroll<strong>in</strong>g of humidity is very important for many manufactur<strong>in</strong>genvironments such as food, automotive and electronics <strong>in</strong>dustries. ZnSnanostructures should be used as humidity and gas sensor due to theirhighly active surface properties.In this work, we explored the humidity sens<strong>in</strong>g capability of ZnSnanostructures us<strong>in</strong>g QCM method, at which the measured frequencyshift is directly proportional to the mass change on a quartz crystal [2],and electrical measurements such as voltage-current (I-V), resistance-RH% and capacitance-frequency (C-f) from 33% RH to 100% RH.ZnS nanostructures were synthesized us<strong>in</strong>g VLS technique. Fig.1shows the morphology of the synthesized nanostructures is nanowireswith their diameters range from 60 nm to 300nm.decreases almost l<strong>in</strong>early with <strong>in</strong>creas<strong>in</strong>g RH. This decreas<strong>in</strong>g ofresistance was about four orders. Typical I-V curves of ZnS nanowiressensor from 33% RH to 100% RH are shown <strong>in</strong> Fig.3b. These I-Vcurves are a straight l<strong>in</strong>e, show<strong>in</strong>g ohmic behavior. Molecules ofmoisture <strong>in</strong>teraction with semiconductor surfaces <strong>in</strong>fluence surfaceconductivity due to physical and chemical adsorption of watermolecules. Charge exchange occurs between adsorbed species from themoisture and the semiconductor surface. Conductivity of ZnSnanowires sensor <strong>in</strong>creases with <strong>in</strong>creas<strong>in</strong>g relative humidity is relatedto amount of the absorption of moisture molecules on the surface ofZnS nanowires sensor.Resistance (Ohm)10 1110 1010 910 810 7y = 6,9462e+11 * e^(-0,11993x) R= 0,96093B10 12 30 40 50 60 70 80 90 10010 610 5Fig. 1: SEM image of the ZnS nanostructuresIn order to monitor humidity sens<strong>in</strong>g properties, ZnS isultrasonically dispersed <strong>in</strong> ethanol and solution was applied on thesurface of quartz crystal and between the two gold (Au) electrodes bydrop-cast<strong>in</strong>g technique for QCM and electrical measurements,respectively. The dropped solution was dried at room temperature untilethanol was totally evaporated. The quartz crystal and electrodesloaded with ZnS nanowires were exposed to the relative humidity at thesame time. Fig. 2 shows the frequency shift of ZnS loaded QCM crystalunder vary<strong>in</strong>g relative humidity (RH) between 45 and 75% for fourhumidity adsorption/desorption cycles. Dur<strong>in</strong>g the adsorption ofmoisture molecules on the sensor surface the frequency shift decreaseswith <strong>in</strong>creas<strong>in</strong>g RH and goes to near saturation values, while frequencyshift decreases dur<strong>in</strong>g the desorption. This is why ZnS nanowiresposses a large specific surface area, moisture molecules adsorb easilyon the sensor surface and the mass of quartz crystal <strong>in</strong>creases with<strong>in</strong>creas<strong>in</strong>g RH.dF/Hz0-200-400-600-800-1000dF/Hz Relative Humidity (%)400 200 400 600 800 1000 1200 1400Fig. 2: The frequency responses of an loaded QCM with drop-casted ZnSnanowires (red squares) compar<strong>in</strong>g with relative humidity values of acommercial sensor (blue circles) for 4 humidity adsorption-desorption cyclesbetween 45% and 75% RH.Fig.3a shows the resistance variation of ZnS nanowires depend<strong>in</strong>gon vary<strong>in</strong>g relative humidity. The resistance of ZnS nanowiresTime (s)8075706560555045Relative Humidity (%)Current (A)Relative Humidity (%)A0,020,0150,010,0050-0,005-0,01-0,015100 33%-0,02-6 -4 -2 0 2 4 6bVoltage (V)Fig. 3: a) The resistance variation, b) the I-V characterization of ZnS nanowiresunder vary<strong>in</strong>g relative humidityIn summary, the QCM and electrical measurements resultsshow that ZnS nanowires can be used for potential humiditysensor application.*Correspond<strong>in</strong>g author:neslihanuzar@istanbul.edu.tr.[1] D.P: Norton, Y.W. Heo, M.P. Ivill, K. Ip, S. J. Pearton, M. F. Chisholm, T.Ste<strong>in</strong>er, Materials Today, 34, 7, (2004)[2] Lukas Schmidt-Mende and Judith L. MacManus-Driscoll, 10, 40-48, 2008.90% %4384% 55%75%55% 84%90% 43%100% 33%6th Nanoscience and Nanotechnology Conference, zmir, 2010 700
- Page 1:
Poster Presentations3rd Day17 June
- Page 4 and 5:
Determination of Dielectric Anisotr
- Page 7 and 8:
Poster Session, Thursday, June 17Th
- Page 9 and 10:
PP mPP vs.P =P,PP (1)P andPoster Se
- Page 11 and 12:
PP mPP vs.P =P,PP (1)P andPoster Se
- Page 13 and 14:
PP andPoster Session, Thursday, Jun
- Page 15 and 16:
Poster Session, Thursday, June 17Th
- Page 17 and 18:
PP and770 772 774 776 778 780 782 7
- Page 19 and 20:
Poster Session, Thursday, June 17Th
- Page 21 and 22:
Poster Session, Thursday, June 17Th
- Page 23 and 24:
P25,Poster Session, Thursday, June
- Page 25 and 26:
PP TOBBPoster Session, Thursday, Ju
- Page 27 and 28:
PisPPisisisP,PisPoster Session, Thu
- Page 29 and 30:
U NeslihanPPPPoster Session, Thursd
- Page 31 and 32:
Poster Session, Thursday, June 17Th
- Page 33 and 34:
PPPoster Session, Thursday, June 17
- Page 35 and 36:
PPoster Session, Thursday, June 17T
- Page 37 and 38:
P onP viaPP wereP upPoster Session,
- Page 39 and 40: P ·cm.PVPPPsPPPPP andPoster Sessio
- Page 41 and 42: Poster Session, Thursday, June 17Th
- Page 43 and 44: PPoster Session, Thursday, June 17T
- Page 45 and 46: PPoster Session, Thursday, June 17T
- Page 47 and 48: Poster Session, Thursday, June 17Th
- Page 49 and 50: PErkanPoster Session, Thursday, Jun
- Page 51 and 52: Poster Session, Thursday, June 17Th
- Page 53 and 54: Poster Session, Thursday, June 17Th
- Page 55 and 56: PPPP andPoster Session, Thursday, J
- Page 57 and 58: Poster Session, Thursday, June 17Th
- Page 59 and 60: Poster Session, Thursday, June 17Th
- Page 61 and 62: T PeptideTPP,PP,PP andTT2429TTTTTT
- Page 63 and 64: Poster Session, Thursday, June 17Th
- Page 65 and 66: PPoster Session, Thursday, June 17T
- Page 67 and 68: Poster Session, Thursday, June 17Th
- Page 69 and 70: PPPoster Session, Thursday, June 17
- Page 71 and 72: Poster Session, Thursday, June 17Th
- Page 73 and 74: Poster Session, Thursday, June 17Th
- Page 75 and 76: PT AdditionalT ThePoster Session, T
- Page 77 and 78: Poster Session, Thursday, June 17Th
- Page 79 and 80: Poster Session, Thursday, June 17Th
- Page 81 and 82: Poster Session, Thursday, June 17Th
- Page 83 and 84: PPoster Session, Thursday, June 17T
- Page 85 and 86: Poster Session, Thursday, June 17Th
- Page 87 and 88: PPPoster Session, Thursday, June 17
- Page 89: Poster Session, Thursday, June 17Hu
- Page 93 and 94: PPPPPPoster Session, Thursday, June
- Page 95 and 96: Poster Session, Thursday, June 17Th
- Page 97 and 98: Poster Session, Thursday, June 17Th
- Page 99 and 100: Poster Session, Thursday, June 17Th
- Page 101 and 102: PPoster Session, Thursday, June 17T
- Page 103 and 104: Poster Session, Thursday, June 17Th
- Page 105 and 106: PPPPPPPoster Session, Thursday, Jun
- Page 107 and 108: Poster Session, Thursday, June 17Th
- Page 109 and 110: PPPR2R PIN(80)PPgPP OzlemPPoster Se
- Page 111 and 112: Poster Session, Thursday, June 17Th
- Page 113 and 114: Poster Session, Thursday, June 17Th
- Page 115 and 116: P onPP toP coordinatedPPoster Sessi
- Page 117 and 118: PPPPP,PP,P(PR RmPoster Session, Thu
- Page 119 and 120: Poster Session, Thursday, June 17Th
- Page 121 and 122: Poster Session, Thursday, June 17Th
- Page 123 and 124: PP InstitutePP DepartmentPoster Ses
- Page 125 and 126: andPCPPoster Session, Thursday, Jun
- Page 127 and 128: PP scatteringPYusufPP Corresponding
- Page 129 and 130: PP toPoster Session, Thursday, June
- Page 131 and 132: PP andPoster Session, Thursday, Jun
- Page 133 and 134: PPPPoster Session, Thursday, June 1
- Page 135 and 136: PPoster Session, Thursday, June 17T
- Page 137 and 138: PPP andP (.cm).Poster Session, Thur
- Page 139 and 140: PP tiltP andP editionPoster Session
- Page 141 and 142:
PP andPPoster Session, Thursday, Ju
- Page 143 and 144:
Poster Session, Thursday, June 17Th
- Page 145 and 146:
PP forP forP edit.PPoster Session,
- Page 147 and 148:
Poster Session, Thursday, June 17Th
- Page 149 and 150:
Poster Session, Thursday, June 17Th
- Page 151 and 152:
PP ionicPP ,PPoster Session, Thursd
- Page 153 and 154:
PP lightPoster Session, Thursday, J
- Page 155 and 156:
Poster Session, Thursday, June 17Th
- Page 157 and 158:
PPoster Session, Thursday, June 17T
- Page 159 and 160:
Poster Session, Thursday, June 17Th
- Page 161 and 162:
PandPoster Session, Thursday, June
- Page 163 and 164:
Poster Session, Thursday, June 17 T
- Page 165 and 166:
PPPoster Session, Thursday, June 17
- Page 167 and 168:
PPoster Session, Thursday, June 17T
- Page 169 and 170:
PPoster Session, Thursday, June 17T
- Page 171 and 172:
PPoster Session, Thursday, June 17T
- Page 173 and 174:
PP DepartmentNanoscienceTPPoster Se
- Page 175 and 176:
Poster Session, Thursday, June 17Th
- Page 177 and 178:
Poster Session, Thursday, June 17Th
- Page 179 and 180:
PPPoster Session, Thursday, June 17
- Page 181 and 182:
PPPPPoster Session, Thursday, June
- Page 183 and 184:
PPPPoster Session, Thursday, June 1
- Page 185 and 186:
PPoster Session, Thursday, June 17T
- Page 187 and 188:
PPoster Session, Thursday, June 17T
- Page 189 and 190:
PPoster Session, Thursday, June 17T
- Page 191 and 192:
Poster Session, Thursday, June 17Th
- Page 193 and 194:
Poster Session, Thursday, June 17Th
- Page 195 and 196:
0T0T0T0T AsPPPP werePoster Session,
- Page 197 and 198:
PPoster Session, Thursday, June 17T
- Page 199 and 200:
PPPPPoster Session, Thursday, June
- Page 201 and 202:
PPoster Session, Thursday, June 17T
- Page 203 and 204:
PPoster Session, Thursday, June 17T
- Page 205 and 206:
Poster Session, Thursday, June 17Th
- Page 207 and 208:
PPoster Session, Thursday, June 17T
- Page 209 and 210:
PPoster Session, Thursday, June 17T
- Page 211:
Poster Session, Thursday, June 17AF


