- Page 2 and 3:
The opinions expressed in the repor
- Page 5 and 6:
Table of ContentsForeword1 Migratio
- Page 7:
Foreword
- Page 10 and 11:
UN recorded that 61 million migrant
- Page 12 and 13:
about this and other programmes. Se
- Page 15:
Introduction
- Page 18 and 19:
overseas ethnic markets; and the wa
- Page 20 and 21:
labor migration. This narrower topi
- Page 22 and 23:
narrowing income inequalities withi
- Page 24 and 25:
and 2004 has increased the urban po
- Page 27:
Connecting Internaland Internationa
- Page 30 and 31:
it comes to questions of migration
- Page 32 and 33:
internal and international migratio
- Page 34 and 35:
the larger cities. British ships we
- Page 36 and 37:
states. At present, as part of our
- Page 38 and 39:
36and one on international migratio
- Page 40 and 41:
perspective 3 that gives methodolog
- Page 42 and 43:
commercial, industrial and service
- Page 44 and 45:
taken place in migration flows. The
- Page 46 and 47:
to what was left of the original en
- Page 48 and 49:
sought refuge in Lima. It was not p
- Page 50 and 51:
husband who sought refuge and work
- Page 52 and 53:
that take place between migrants an
- Page 54 and 55:
to the flows of goods, resources an
- Page 56 and 57:
migration and close to Huancayo) or
- Page 58 and 59:
In some cases, families would regul
- Page 60 and 61:
Furthermore, the precise compositio
- Page 62 and 63: This suggests that, instead of aimi
- Page 64 and 65: Brynes, D.M.2003 Driving the State:
- Page 66 and 67: 1984 Miners, Peasants and Entrepren
- Page 68 and 69: Werbner, P.1990 The Migration Proce
- Page 70 and 71: Genealogy 1: Jiménez Family in 197
- Page 72 and 73: Since the 1990s, there has been a b
- Page 74 and 75: migrant receiving areas, 2 but focu
- Page 76 and 77: well as discussing some of the cons
- Page 78 and 79: carried to Ghana by migrants. 40 pe
- Page 80 and 81: Table 2. Cost (in Euro) of Formal a
- Page 82 and 83: home countries, for example, throug
- Page 84 and 85: These insurance events can constitu
- Page 86 and 87: Having people collect similar data
- Page 88 and 89: people they knew. In fact, some of
- Page 90 and 91: For migration research, this means
- Page 92 and 93: ReferencesAppadurai, A.1996 Moderni
- Page 94 and 95: Glick Schiller, N., and G. Fouron19
- Page 96 and 97: Marcus, G.1995 “Ethnography in/of
- Page 98 and 99: Portes, A., and J. DeWind2004 “A
- Page 100 and 101: Stark, O., and D. Bloom1985 “The
- Page 102 and 103: AppendixTable A.1. Two-country Tran
- Page 104 and 105: initially entails high costs and ri
- Page 106 and 107: To our knowledge, no study has esti
- Page 108 and 109: 2.1 Remittances and Income in Rural
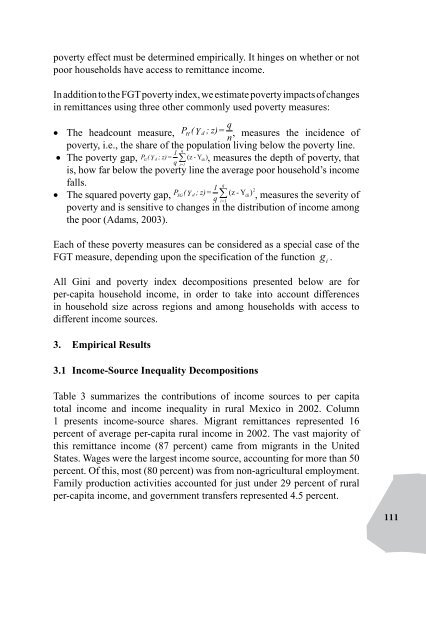
- Page 110 and 111: with its neat correspondence to the
- Page 114 and 115: Table 3. Gini Decomposition by Inco
- Page 116 and 117: Table 4b. Gini Decomposition by Inc
- Page 118 and 119: 3.2 Effects of Migrant Remittances
- Page 120 and 121: 4. ConclusionsOur findings using na
- Page 122 and 123: Knowles, J.C., and R.B. Anker1981
- Page 124 and 125: Taylor, J.E.1992 “Remittances and
- Page 126 and 127: 124Table 2. Rural Mexico Household
- Page 128 and 129: Central Region45Percentage of Villa
- Page 130 and 131: 128Figure 3. Relationship between P
- Page 133 and 134: 7Labor Market Flooding? Migrant Des
- Page 135 and 136: Reibel (1997); David Card (2001); a
- Page 137 and 138: The net immigration rate can be tak
- Page 139 and 140: is S 0. It establishes an equilibri
- Page 141 and 142: consequence a highly elastic supply
- Page 143 and 144: in the populous fourteen states of
- Page 145 and 146: out were both at work in this case
- Page 147 and 148: Figure 7 identifies what we call
- Page 149 and 150: Figure 9. Total Net In-Migration an
- Page 151 and 152: Figure 10. Dynamic Economy ModelFig
- Page 153 and 154: 6. ConclusionThe dynamic and open e
- Page 155 and 156: ReferencesAbowd, J.M., and R. Freem
- Page 157 and 158: 1999 “Historical perspectives on
- Page 159 and 160: Hatton, T., and J.G. Williamson1998
- Page 161: White, M.J. and Y. Imai1994 “The
- Page 164 and 165:
seasonal basis, to areas with more
- Page 166 and 167:
for agricultural labor were 15 and
- Page 168 and 169:
3. Why People MoveThe decision to m
- Page 170 and 171:
producers are facing heavy losses a
- Page 172 and 173:
in Mumbai, which capitalizes on peo
- Page 174 and 175:
In conclusion, migration can bring
- Page 176 and 177:
is also being experienced in many r
- Page 178 and 179:
ReferencesBal Kumar, K.C.2003 “Mi
- Page 180 and 181:
Lipton, M.1980 “Migration from ru
- Page 182 and 183:
Shylendra, H.S., and P. Thomas1995
- Page 184 and 185:
182Able-bodied men.Women migrateonl
- Page 186 and 187:
Majority of (ST)Baiga and Ghondsmig
- Page 188 and 189:
Single caste villageof (OBC) Dhimar
- Page 191 and 192:
9A Socio-Cultural Perspective on Mi
- Page 193 and 194:
of households reported having at le
- Page 195 and 196:
Drawing on these perspectives, I ar
- Page 197 and 198:
migration tend to imitate the behav
- Page 199 and 200:
What is presented below is therefor
- Page 201 and 202:
ate of exchange and was thus sent t
- Page 203 and 204:
which was an important consideratio
- Page 205 and 206:
some migrants had started chitties,
- Page 207 and 208:
The extended family constituted a c
- Page 209 and 210:
much individuals had “locked up i
- Page 211 and 212:
edistribution were enforced through
- Page 213 and 214:
and the definition of status in eac
- Page 215 and 216:
perceived, the status-seeking activ
- Page 217 and 218:
Engelbrektsson, U.1978 The force of
- Page 219 and 220:
Parry, J. and M. Bloch1989 “Intro
- Page 221 and 222:
10Migrant Workers’ Remittances an
- Page 223 and 224:
in labor migration emerged after, a
- Page 225 and 226:
husband and wife, four daughters an
- Page 227 and 228:
(Table 3). In the central and weste
- Page 229 and 230:
Table 5. Composition of Rural House
- Page 231 and 232:
Figure 3. Rural households’ Net I
- Page 233 and 234:
schistosomiasis, etc. This decline
- Page 235 and 236:
of them deposit the money in a bank
- Page 237 and 238:
to train new rural migrants in the
- Page 239 and 240:
Figure 4. Per Capita Temittance in
- Page 241 and 242:
ReferencesBai Nansheng et al.2002
- Page 243 and 244:
Lu Mai et al.2002 “Zhongguo nongc
- Page 245:
Xinhuanet2002 “Woguo Zhongxibu la
- Page 248 and 249:
agriculture (Cook 1999), producing
- Page 250 and 251:
evenue (MR) minus the marginal cost
- Page 252 and 253:
Before reform, the annual quota of
- Page 254 and 255:
Table 2 Regional Distribution of In
- Page 256 and 257:
Figure 3. Sources of China’s Econ
- Page 258 and 259:
migration are removed, all wage and
- Page 260 and 261:
urban-biased policies persisted, pr
- Page 262 and 263:
eform. Under the hukou system, Chin
- Page 264 and 265:
The institutional barriers faced by
- Page 266 and 267:
ecause of the rapid migration of th
- Page 268 and 269:
Migrant workers have hardly any opp
- Page 270 and 271:
ReferencesAu, Chun-Chung, and Verno
- Page 272 and 273:
Lin, Justin, Gewei Wang, and Yaohui
- Page 275 and 276:
12International Migration and Devel
- Page 277 and 278:
2. BackgroundThe recent rise in int
- Page 279 and 280:
of remittances: self-employment, a
- Page 281 and 282:
Given the size of recent emigration
- Page 283 and 284:
5. Remittances: An OverviewTable 1
- Page 285 and 286:
interpret. Some of it may be caused
- Page 287 and 288:
8. A Decision to Repatriate MoneyIn
- Page 289 and 290:
emittances in the year prior to the
- Page 291 and 292:
fourth one, Xiamen, is in Fujian Pr
- Page 293 and 294:
ReferencesAdelman, I., J.E. Taylor,
- Page 295 and 296:
Massey, D.1988 “International mig
- Page 297 and 298:
AppendixTable 1. Village-Level Remi
- Page 299 and 300:
Table 4. Logistic Regression Models
- Page 301 and 302:
Table 6. Logistic Regression Models
- Page 303 and 304:
Table 8. Logistic Regression Models
- Page 305 and 306:
13Remittances in the Latin American
- Page 307 and 308:
to anti-money laundering and suspic
- Page 309 and 310:
Finally, mulas may be sporadic trav
- Page 311 and 312:
has left from countries in Western
- Page 313 and 314:
Table 2: Remittances and Key Econom
- Page 315 and 316:
Source: National Money Transmitters
- Page 317 and 318:
One way this redistributive effect
- Page 319 and 320:
Managua reported having a relative
- Page 321 and 322:
America have a higher rate of havin
- Page 323 and 324:
Table 9 Frequency of Immigrant Trav
- Page 325 and 326:
Guyana offers an interesting exampl
- Page 327 and 328:
In addition to exports of these goo
- Page 329 and 330:
Hemisphere. Figure 7 refers to the
- Page 331 and 332:
alternatives. Five years ago, it wa
- Page 333 and 334:
concentration is pronounced, innova
- Page 335 and 336:
emittance recipients have a higher
- Page 337 and 338:
AppendixData Methodology on Pricing
- Page 339 and 340:
Fagen, P., and M. Bump2005 “Remit
- Page 341:
2003 Receptores de remesas en Ecuad
- Page 345 and 346:
14A Framework for Linking and Compa
- Page 347 and 348:
to jobs, savings, and networks that
- Page 349 and 350:
were expanding. That “flooding”
- Page 351 and 352:
ural families to repay debts, satis
- Page 353 and 354:
ut case studies, including that of
- Page 355 and 356:
would do well to examine how variou
- Page 357 and 358:
Carter and Sutch challenge the argu
- Page 359 and 360:
networks combine internal and inter
- Page 361 and 362:
4. Policy ImplicationsWhat implicat
- Page 363 and 364:
government should improve migrant w
- Page 365 and 366:
challenge for development practitio
- Page 367 and 368:
community members could help to cla
- Page 369:
itself). While research and analysi