- Page 1 and 2:
American International Group, Inc.2
- Page 3 and 4:
KEY FACTS & FIGURES52,000+ $65.7 bi
- Page 5 and 6:
■We said we would return to profi
- Page 7 and 8:
Financial HighlightsYears Ended Dec
- Page 9 and 10:
~63,000AIG EMPLOYEES AROUND THE WOR
- Page 11 and 12:
$115.1 millionAVERAGE CLAIMS PAID E
- Page 13 and 14:
$10,000MAXIMUM DONATION MADE BY AIG
- Page 15 and 16:
American International Group, Inc.F
- Page 18 and 19:
AMERICAN INTERNATIONAL GROUP, INC.A
- Page 20 and 21:
ITEM 1 / BUSINESS / AIG............
- Page 22 and 23:
ITEM 1 / BUSINESS / AIG............
- Page 24 and 25: ITEM 1 / BUSINESS / AIG PROPERTY CA
- Page 27 and 28: ITEM 1 / BUSINESS / AIG PROPERTY CA
- Page 29 and 30: ITEM 1 / BUSINESS / AIG LIFE AND RE
- Page 31 and 32: ITEM 1 / BUSINESS / AIG LIFE AND RE
- Page 33 and 34: ITEM 1 / BUSINESS / AIG LIFE AND RE
- Page 35 and 36: ITEM 1 / BUSINESS / OTHER OPERATION
- Page 37 and 38: ITEM 1 / BUSINESS / OTHER OPERATION
- Page 39 and 40: ITEM 1 / BUSINESS..................
- Page 41 and 42: ITEM 1 / BUSINESS..................
- Page 43 and 44: ITEM 1 / BUSINESS..................
- Page 45 and 46: ITEM 1 / BUSINESS..................
- Page 47 and 48: ITEM 1 / BUSINESS..................
- Page 49 and 50: ITEM 1A / RISK FACTORS.............
- Page 51 and 52: ITEM 1A / RISK FACTORS.............
- Page 53 and 54: ITEM 1A / RISK FACTORS.............
- Page 55 and 56: ITEM 1A / RISK FACTORS.............
- Page 57 and 58: ITEM 1A / RISK FACTORS.............
- Page 59 and 60: ITEM 1A / RISK FACTORS.............
- Page 61 and 62: ITEM 1B / UNRESOLVED STAFF COMMENTS
- Page 63 and 64: ITEM 5 / MARKET FOR REGISTRANT’S
- Page 65 and 66: ITEM 6 / SELECTED FINANCIAL DATA...
- Page 67 and 68: ITEM 6 / SELECTED FINANCIAL DATA...
- Page 69 and 70: ITEM 7 / MANAGEMENT’S DISCUSSION
- Page 71 and 72: ITEM 7 / USE OF NON-GAAP MEASURES..
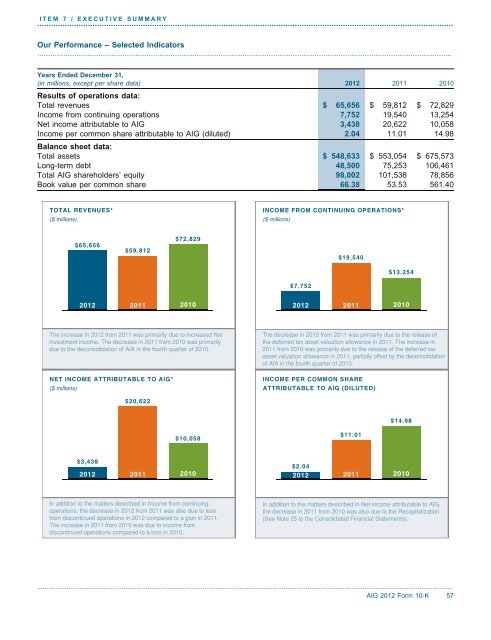
- Page 73: ITEM 7 / EXECUTIVE SUMMARY.........
- Page 77 and 78: ITEM 7 / EXECUTIVE SUMMARY.........
- Page 79 and 80: ITEM 7 / EXECUTIVE SUMMARY.........
- Page 81 and 82: ITEM 7 / EXECUTIVE SUMMARY.........
- Page 83 and 84: ITEM 7 / EXECUTIVE SUMMARY.........
- Page 85 and 86: ITEM 7 / RESULTS OF OPERATIONS.....
- Page 87 and 88: ITEM 7 / RESULTS OF OPERATIONS.....
- Page 89 and 90: ITEM 7 / RESULTS OF OPERATIONS.....
- Page 91 and 92: ITEM 7 / RESULTS OF OPERATIONS.....
- Page 93 and 94: ITEM 7 / RESULTS OF OPERATIONS.....
- Page 95 and 96: ITEM 7 / RESULTS OF OPERATIONS.....
- Page 97 and 98: ITEM 7 / RESULTS OF OPERATIONS.....
- Page 99 and 100: ITEM 7 / RESULTS OF OPERATIONS.....
- Page 101 and 102: ITEM 7 / RESULTS OF OPERATIONS.....
- Page 103 and 104: ITEM 7 / RESULTS OF OPERATIONS.....
- Page 105 and 106: ITEM 7 / RESULTS OF OPERATIONS.....
- Page 107 and 108: ITEM 7 / RESULTS OF OPERATIONS.....
- Page 109 and 110: ITEM 7 / RESULTS OF OPERATIONS.....
- Page 111 and 112: ITEM 7 / RESULTS OF OPERATIONS.....
- Page 113 and 114: ITEM 7 / RESULTS OF OPERATIONS.....
- Page 115 and 116: ITEM 7 / RESULTS OF OPERATIONS.....
- Page 117 and 118: ITEM 7 / RESULTS OF OPERATIONS.....
- Page 119 and 120: ITEM 7 / RESULTS OF OPERATIONS.....
- Page 121 and 122: ITEM 7 / RESULTS OF OPERATIONS.....
- Page 123 and 124: ITEM 7 / RESULTS OF OPERATIONS.....
- Page 125 and 126:
ITEM 7 / RESULTS OF OPERATIONS.....
- Page 127 and 128:
ITEM 7 / RESULTS OF OPERATIONS.....
- Page 129 and 130:
ITEM 7 / RESULTS OF OPERATIONS.....
- Page 131 and 132:
ITEM 7 / RESULTS OF OPERATIONS.....
- Page 133 and 134:
ITEM 7 / RESULTS OF OPERATIONS.....
- Page 135 and 136:
ITEM 7 / RESULTS OF OPERATIONS.....
- Page 137 and 138:
ITEM 7 / LIQUIDITY AND CAPITAL RESO
- Page 139 and 140:
ITEM 7 / LIQUIDITY AND CAPITAL RESO
- Page 141 and 142:
ITEM 7 / LIQUIDITY AND CAPITAL RESO
- Page 143 and 144:
ITEM 7 / LIQUIDITY AND CAPITAL RESO
- Page 145 and 146:
ITEM 7 / LIQUIDITY AND CAPITAL RESO
- Page 147 and 148:
ITEM 7 / LIQUIDITY AND CAPITAL RESO
- Page 149 and 150:
ITEM 7 / LIQUIDITY AND CAPITAL RESO
- Page 151 and 152:
ITEM 7 / LIQUIDITY AND CAPITAL RESO
- Page 153 and 154:
ITEM 7 / LIQUIDITY AND CAPITAL RESO
- Page 155 and 156:
ITEM 7 / INVESTMENTS...............
- Page 157 and 158:
ITEM 7 / INVESTMENTS...............
- Page 159 and 160:
ITEM 7 / INVESTMENTS...............
- Page 161 and 162:
ITEM 7 / INVESTMENTS...............
- Page 163 and 164:
ITEM 7 / INVESTMENTS...............
- Page 165 and 166:
ITEM 7 / INVESTMENTS...............
- Page 167 and 168:
ITEM 7 / INVESTMENTS...............
- Page 169 and 170:
ITEM 7 / INVESTMENTS...............
- Page 171 and 172:
ITEM 7 / INVESTMENTS...............
- Page 173 and 174:
ITEM 7 / ENTERPRISE RISK MANAGEMENT
- Page 175 and 176:
ITEM 7 / ENTERPRISE RISK MANAGEMENT
- Page 177 and 178:
ITEM 7 / ENTERPRISE RISK MANAGEMENT
- Page 179 and 180:
ITEM 7 / ENTERPRISE RISK MANAGEMENT
- Page 181 and 182:
ITEM 7 / ENTERPRISE RISK MANAGEMENT
- Page 183 and 184:
ITEM 7 / ENTERPRISE RISK MANAGEMENT
- Page 185 and 186:
ITEM 7 / ENTERPRISE RISK MANAGEMENT
- Page 187 and 188:
ITEM 7 / ENTERPRISE RISK MANAGEMENT
- Page 189 and 190:
ITEM 7 / CRITICAL ACCOUNTING ESTIMA
- Page 191 and 192:
ITEM 7 / CRITICAL ACCOUNTING ESTIMA
- Page 193 and 194:
ITEM 7 / CRITICAL ACCOUNTING ESTIMA
- Page 195 and 196:
ITEM 7 / CRITICAL ACCOUNTING ESTIMA
- Page 197 and 198:
ITEM 7 / CRITICAL ACCOUNTING ESTIMA
- Page 199 and 200:
ITEM 7 / CRITICAL ACCOUNTING ESTIMA
- Page 201 and 202:
ITEM 7 / CRITICAL ACCOUNTING ESTIMA
- Page 203 and 204:
ITEM 7 / CRITICAL ACCOUNTING ESTIMA
- Page 205 and 206:
ITEM 7 / CRITICAL ACCOUNTING ESTIMA
- Page 207 and 208:
ITEM 7 / CRITICAL ACCOUNTING ESTIMA
- Page 209 and 210:
ITEM 7 / CRITICAL ACCOUNTING ESTIMA
- Page 211 and 212:
ITEM 7 / CRITICAL ACCOUNTING ESTIMA
- Page 213 and 214:
ITEM 7 / GLOSSARY..................
- Page 215 and 216:
ITEM 7 / GLOSSARY..................
- Page 217 and 218:
ITEM 7A / QUANTITATIVE AND QUALITAT
- Page 219 and 220:
ITEM 8 / INDEX TO FINANCIAL STATEME
- Page 221 and 222:
AMERICAN INTERNATIONAL GROUP, INC.C
- Page 223 and 224:
AMERICAN INTERNATIONAL GROUP, INC.C
- Page 225 and 226:
AMERICAN INTERNATIONAL GROUP, INC.C
- Page 227 and 228:
ITEM 8 / NOTE 1. BASIS OF PRESENTAT
- Page 229 and 230:
ITEM 8 / NOTE 2. SUMMARY OF SIGNIFI
- Page 231 and 232:
ITEM 8 / NOTE 2. SUMMARY OF SIGNIFI
- Page 233 and 234:
ITEM 8 / NOTE 2. SUMMARY OF SIGNIFI
- Page 235 and 236:
ITEM 8 / NOTE 2. SUMMARY OF SIGNIFI
- Page 237 and 238:
ITEM 8 / NOTE 2. SUMMARY OF SIGNIFI
- Page 239 and 240:
ITEM 8 / NOTE 2. SUMMARY OF SIGNIFI
- Page 241 and 242:
ITEM 8 / NOTE 3. SEGMENT INFORMATIO
- Page 243 and 244:
ITEM 8 / NOTE 3. SEGMENT INFORMATIO
- Page 245 and 246:
ITEM 8 / NOTE 4. DIVESTED BUSINESSE
- Page 247 and 248:
ITEM 8 / NOTE 4. DIVESTED BUSINESSE
- Page 249 and 250:
ITEM 8 / NOTE 5. BUSINESS COMBINATI
- Page 251 and 252:
ITEM 8 / NOTE 6. FAIR VALUE MEASURE
- Page 253 and 254:
ITEM 8 / NOTE 6. FAIR VALUE MEASURE
- Page 255 and 256:
ITEM 8 / NOTE 6. FAIR VALUE MEASURE
- Page 257 and 258:
ITEM 8 / NOTE 6. FAIR VALUE MEASURE
- Page 259 and 260:
ITEM 8 / NOTE 6. FAIR VALUE MEASURE
- Page 261 and 262:
ITEM 8 / NOTE 6. FAIR VALUE MEASURE
- Page 263 and 264:
ITEM 8 / NOTE 6. FAIR VALUE MEASURE
- Page 265 and 266:
ITEM 8 / NOTE 6. FAIR VALUE MEASURE
- Page 267 and 268:
ITEM 8 / NOTE 6. FAIR VALUE MEASURE
- Page 269 and 270:
ITEM 8 / NOTE 7. INVESTMENTS.......
- Page 271 and 272:
ITEM 8 / NOTE 7. INVESTMENTS.......
- Page 273 and 274:
ITEM 8 / NOTE 7. INVESTMENTS.......
- Page 275 and 276:
ITEM 8 / NOTE 7. INVESTMENTS.......
- Page 277 and 278:
ITEM 8 / NOTE 7. INVESTMENTS.......
- Page 279 and 280:
ITEM 8 / NOTE 7. INVESTMENTS.......
- Page 281 and 282:
ITEM 8 / NOTE 7. INVESTMENTS.......
- Page 283 and 284:
ITEM 8 / NOTE 8. LENDING ACTIVITIES
- Page 285 and 286:
ITEM 8 / NOTE 9. REINSURANCE.......
- Page 287 and 288:
ITEM 8 / NOTE 10. DEFERRED POLICY A
- Page 289 and 290:
ITEM 8 / NOTE 10. DEFERRED POLICY A
- Page 291 and 292:
ITEM 8 / NOTE 11. VARIABLE INTEREST
- Page 293 and 294:
ITEM 8 / NOTE 11. VARIABLE INTEREST
- Page 295 and 296:
ITEM 8 / NOTE 12. DERIVATIVES AND H
- Page 297 and 298:
ITEM 8 / NOTE 12. DERIVATIVES AND H
- Page 299 and 300:
ITEM 8 / NOTE 12. DERIVATIVES AND H
- Page 301 and 302:
ITEM 8 / NOTE 13. LIABILITY FOR UNP
- Page 303 and 304:
ITEM 8 / NOTE 14. VARIABLE LIFE AND
- Page 305 and 306:
ITEM 8 / NOTE 15. DEBT OUTSTANDING.
- Page 307 and 308:
ITEM 8 / NOTE 15. DEBT OUTSTANDING.
- Page 309 and 310:
ITEM 8 / NOTE 16. CONTINGENCIES, CO
- Page 311 and 312:
ITEM 8 / NOTE 16. CONTINGENCIES, CO
- Page 313 and 314:
ITEM 8 / NOTE 16. CONTINGENCIES, CO
- Page 315 and 316:
ITEM 8 / NOTE 16. CONTINGENCIES, CO
- Page 317 and 318:
ITEM 8 / NOTE 16. CONTINGENCIES, CO
- Page 319 and 320:
ITEM 8 / NOTE 16. CONTINGENCIES, CO
- Page 321 and 322:
ITEM 8 / NOTE 17. TOTAL EQUITY.....
- Page 323 and 324:
ITEM 8 / NOTE 17. TOTAL EQUITY.....
- Page 325 and 326:
ITEM 8 / NOTE 17. TOTAL EQUITY.....
- Page 327 and 328:
ITEM 8 / NOTE 18. NONCONTROLLING IN
- Page 329 and 330:
ITEM 8 / NOTE 19. EARNINGS (LOSS) P
- Page 331 and 332:
ITEM 8 / NOTE 20. STATUTORY FINANCI
- Page 333 and 334:
ITEM 8 / NOTE 21. SHARE-BASED COMPE
- Page 335 and 336:
ITEM 8 / NOTE 21. SHARE-BASED COMPE
- Page 337 and 338:
ITEM 8 / NOTE 22. EMPLOYEE BENEFITS
- Page 339 and 340:
ITEM 8 / NOTE 22. EMPLOYEE BENEFITS
- Page 341 and 342:
ITEM 8 / NOTE 22. EMPLOYEE BENEFITS
- Page 343 and 344:
ITEM 8 / NOTE 22. EMPLOYEE BENEFITS
- Page 345 and 346:
ITEM 8 / NOTE 22. EMPLOYEE BENEFITS
- Page 347 and 348:
ITEM 8 / NOTE 24. INCOME TAXES.....
- Page 349 and 350:
ITEM 8 / NOTE 24. INCOME TAXES.....
- Page 351 and 352:
ITEM 8 / NOTE 24. INCOME TAXES.....
- Page 353 and 354:
ITEM 8 / NOTE 26. QUARTERLY FINANCI
- Page 355 and 356:
ITEM 8 / NOTE 27. INFORMATION PROVI
- Page 357 and 358:
ITEM 8 / NOTE 27. INFORMATION PROVI
- Page 359 and 360:
ITEM 8 / NOTE 27. INFORMATION PROVI
- Page 361 and 362:
PART II............................
- Page 363 and 364:
PART IV............................
- Page 365 and 366:
SignatureTitle/s/ ARTHUR C. MARTINE
- Page 367 and 368:
ExhibitNumber Description Location(
- Page 369 and 370:
ExhibitNumber Description Location(
- Page 371 and 372:
ExhibitNumber Description Location(
- Page 373 and 374:
ExhibitNumber Description Location(
- Page 375 and 376:
Condensed Financial Information of
- Page 377 and 378:
Condensed Financial Information of
- Page 379 and 380:
Notes to Condensed Financial Inform
- Page 381 and 382:
Supplementary Insurance Information
- Page 383 and 384:
Valuation and Qualifying AccountsFo
- Page 385 and 386:
Subsidiaries of RegistrantExhibit 2
- Page 387 and 388:
Percentageof VotingSecuritiesJurisd
- Page 389 and 390:
Percentageof VotingSecuritiesJurisd
- Page 391 and 392:
CONSENT OF INDEPENDENT REGISTERED P
- Page 393 and 394:
CERTIFICATIONSI, Robert H. Benmosch
- Page 395 and 396:
CERTIFICATIONExhibit 32In connectio
- Page 397 and 398:
SECURITIES REGISTERED PURSUANT TO S
- Page 399:
American International Group, Inc.1