

Economic Report of the President
Report - The American Presidency Project
Report - The American Presidency Project
- No tags were found...

You also want an ePaper? Increase the reach of your titles
YUMPU automatically turns print PDFs into web optimized ePapers that Google loves.
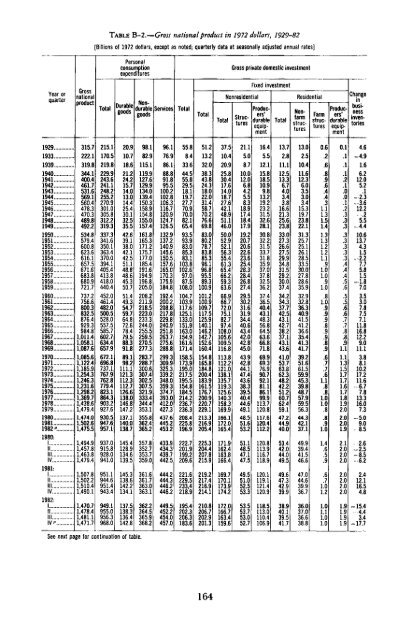
TABLE B-2.—Gross national product in 1972 dollars, 1929-82[Billions <strong>of</strong> 1972 dollars, except as noted; quarterly data at seasonally adjusted annual rates]Year orquarterGrossnationalproduct1929193319391940194119421943194419451946194719481949195019511952195319541955195619571958195919601961196219631964198519661967196819691970197119721973197419751978197719781979198019811982".1980:IIIIllIV1981:IIIIllIV1982:IIIIllIV"315.7222.1319.8344.1400.4461.7531.6569.1560.4478.3470.3489.8492.2534.8579.4600.8623.6616.1657.56/1.6683.8680.9721.7737.2756.6800.3832.5876.4929.3984.81,011.41,058.11,087.61,085.61,122.41,185.91,254.31,246.31,231.61,298.21,369.71,438.61,479.41,474.01,502.61,475.51,494.91,457.81,463.81,479.41,507.81,502.21,510.41,490.11,470.71,478.41,481.11,471.7PersonalconsumptionexpendituresTotalDurablegoods215.1170.5219.8229.9243.6241.1248.2255.2270.9301.0305.8312,2319.3337.3341.6350.1363.4370.0394.1405.4413.8418.0440.4452.0461.4482.0500.5528.0557.5585.7602.7634.4657.9672.1696.8737.1767.9762.8779.4823.1864.3903.2927.6930.5947.6957.1937.0915.8928.0941.0951.1944.6951.4943.4949.1955.0956.3968.0durable Services20.910.718.621.224.215.714.013.014.425.430.132.535.542.639.138.042.142.551.148.848.645.350.751.449.354.759.764.872.678.479.588.391.889.198.2111.1121.3112.3112.7126.6138.0146.8147.2137.1140.0138.7145.4128.9134.6139.5145.3138.6142.2134.1137.5138.3136.4142.8Nonlurablgoods98.182.9115.1119.9127.6129.9134.0139.4150.3158.9154.8155.0157.4161.8165.3171.2175.7177.0185.4191.6194.9196.8205.0208.2211.9218.5223.0233.3244.0255.5259.5270.5277.3283.7288.7300.6307.4302.5307.5321.9333.4344.4353.1355.8362.4365.2357.8352.7353.7359.0361.6361.7363.0363.1362.2364.5365.9368.296.176.986.188.891.895.5100.2102.8106.3116.7120.9124.7126.5132.9137.2140.9145.6150.5157.6165.0170.3175.9184.8192.4200.2208.8217.8229.8240.9251.8263.7275.6288.8299.3309.9325.3339.2348.0359.3374.7393.0412.0427.3437.6445.2453.2433.9434.3439.7442.5444.2444.3446.2446.2449.5452.2454.0457.0Gross private domestic investmentTotal55.88.433.644.555.829.518.119.727.770.970.082.165.493.593.983.085.383.1103.8102.697.087.5108.0104.7103.9117.6125.1133.0151.9163.0154.9161.6171.4158.5173.9195.0217.5195.5154.8184.5214.2236.7236.3208.4225.8196.9222.7201.9199.2209.6221.6229.5233.4218.9195.4202.3206.3183.6Fixed investmentTotal51.213.232.038.343.824.318.022.031.458.770.276.669.883.080.278.783.885.396.196.895.589.3100.9101.2100.9109.7117.5125.9140.1146.2142.7152.6160.4154.8165.8184.8200.4183.9161.5176.7200.9220.7229.1213.3216.9205.4225.3204.4207.8215.9219.2217.4216.9214.1210.8206.7202.9201.3NonresidentialTotal37.510.420.925.830.417.614.018.727.642.148.951.146.050.052.952.156.355.461.365.466.259.363.666.966.772.075.182.797.4108.0105.6109.5116.8113.8112.2121.0138.1135,7119.3125.6140.3158.3169.9166.1172.0165.4171.9162.4163.8166.4169.7170.1173.9174.2172.0166.7163.4159.6StructuresProducers'durableequipment21.15.08.710.012.06.84.25.58.318.917.418.417.919.220.720.622.623.625.428.328.426.827.429.530.231.631.934.440,643.442.042.845.043.942.844.147.443.638.339.540.444.649.148.551.653.251.148.547.147.549.551.052.553.353.553.753.052.716.45.512.115.818.510.99.813.219.223.231.532.628.130.832.231.533.731.835.937.037.832.536.237.436.540.443.148.356.864.563.666.871.869.969.376.990.792.181.186.199.9113.7120.8117.6120.4112.2120.8113.9116.7118.9120.1119.1121.4120.9118.5113.0110.4106.9ResidentialTotal13.72.811.112.513.36.74.03.43.816.621.325.623.833.027.326.627.529.934.831.529.230.037.434.234.337.742.543.142.738.237.143.143.641.053.763.862.348.242.251.260.762.459.147.244.940.053.442.044.049,549.647.342.939.938.940.139.541.7Nonfarmstructures13.02.510.411.612.36.03.53.03.415.319.723.822.131.325.725.126.128.533.530.027.828.635.932.932,836.340.941.541.236.635.441.341.739.251.661.559.945.339.848.757.959.556.344.342.137.149.939.441.546.647.044.639.936.736.037.036.638.8FarmstructuresProducers'durableequipment0.6Changeinbusinessinventories0.1.1.2.1.0.0.1.2.3.3.3.3.3.3.3.3.4.4.4.5.6.5.5.6.6.7.7.8.8.91.11.11.31.51.71.71.61.71.81.92.02.02.01.92.12.02.02.02.02.02.02.01.91.91.91.94.6=4.91.66.212.05.2~2!3~3.fi12.2.25.5-4.410.613.74.31.5-2.27.75.81.5= 1.87.03.53.07.87.57.111.816.81119.011.13.88.110.217.211.6-6.77.813.316.07.3-5.09.08.52.6--2.5-8.5-6.22.412.116.54.8= 15.44.43.4= 17.7See next page for continuation <strong>of</strong> table.164


