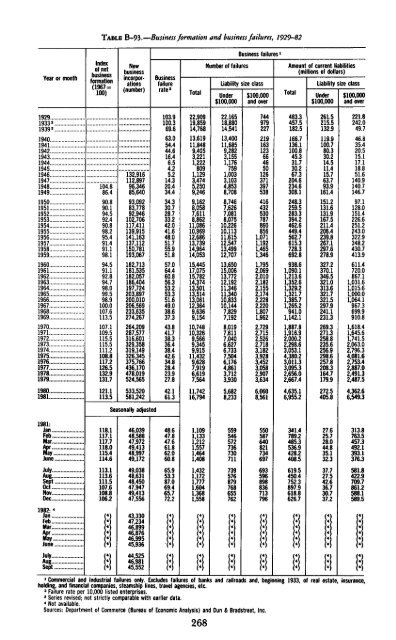
TABLE B-93.—Business formation and business failures, 1929-82Year or monthIndex<strong>of</strong> netbusinessformation(1967=100)businessincorporations(number)Businessfailurerate 2TotalNumber <strong>of</strong> failuresBusiness failures 1Liability size classUnder$100,000$100,000and overAmount <strong>of</strong> current liabilities(millions <strong>of</strong> dollars)TotalLiability size classUnder$100,000$100,000and over19291933 s1939"194019411942194319441945194619471948194919501951195219531954195519561957195819591960196119621963196419651966196719681969197019711972197319741975...1976197719781979104.886.490.890.194.592.490.898.295.491.491.198.194.591.192.894.798.099.598.9100.0107.6113.5107.1109.5115.5115.5111.2108.8117.2126.5132.9131.7132,916112,89796,34685,64093,09283,77892,946102,706117,411139,915141,163137,112150,781193,067182,713181,535182,057186,404197,724203,897200,010206,569233,635274,267264,209287,577316,601329,358319,149326,345375,766436,170478,019524,565103.9100.369.663.054.444.616.46.54.25.214.320.434.434.330.728.733.242.041.648.051.755.951.857.064.460.856.353.253.351.649.038.637.343.841.738.336.438.442.634.828.423.927.822,90919,85914,76813,61911,8489,4053,2211,2228091,1293,4745,2509,2469,1628,0587,6118,86211,08610,96912,68613,73914,96414,05315,44517,07515,78214,37413,50113,51413,06112,3649,6369,15410,74810,3269,5669,3459,91511,4329,6287,9196,6197,56422,16514,54113,40011,6859,2823,1551,1767591,0033,1034,8538,7088,7467,6267,0818,07510,22610,11311,61512,547L3.49912,70713,650L5.00613,77212,19211,346L1.34010,83310,1447,8297,1928,0197,6117,0406,6276,7337,5046,1764,8613,7123,9307449792272191631236646501263713975384164325307878561,0711,1921,4651,3461,7952,0692,0102,1822,1552,1742,2282,2201,8071,9622,7292,7152,5262,7183,1823,9283,4523,0582,9073,634483.3457.5182.5166.7136.1100.845.331.730.267.3204.6234.6308.1248.3259.5283.3394.2462.6449.4562.7615.3728.3692.8938.61,090.11,213.61,352.61,329.21,321.71,385.71,265.2941.01,142.11,887.81,916.92,000.22,298.63,053.14,380.23,011.33,095.32,656.02,667.4261.5215.5132.9119.910O.780.330.214.511.415.763.793.9161.4151.2131.6131.9167.5211.4206.4239.8267.1297.6278.9327.2370.1346.5321.0313.6321.7321.5297.9241.1231.3269.3271.3258.8235.6256.9298.6257.8208.3164.7179.9221.8242.049.746.835.420.515.117.118.851.6140.9140.7146.797.1128.0151.4226.6251.2243.0322.9348.2430.7413.9611.4720.0867.11,031.61,015.61,000.01,064.1967.3699.9910.81,618.41,645.61,741.52,063.02,796.34,081.62,753.42,887.02,491.32,487.51980...1981...121.1113.5533,520581,24242.161.311,74216,7945,6828,2336,0608,5614,635.16,955.2272.5405.84,362.66,549.3Seasonally adjusted1981:Jan..,Feb..Mar..,&July..,Aug..,Sept,Oct...Nov...Dec,1982:
AGRICULTURETABLE B-94.—Farm income, 1929-82[Billions <strong>of</strong> dollars; quarterly data at seasonally adjusted annual rates]Income <strong>of</strong> farm operators fromarmingGross farm incomeNet farm incomeYear or quarterTotal 1TotalCash marketing receiptsLivestockandproductsCropsValue <strong>of</strong>inventorychanges"ProductionexpensesCurrentdollars1967dollars 319291933193913.86.910.711.35.37.96.22.84.55.12.53.3-0.1-.2.17.74.46.36.22.64.412.06.610.6194019411942194319441945194619471948194911.314.319 923 324.025.429.632 436 530.88.411.115.619.620.521.724.829.630.227.84.96.59.011.511.412.013.816.517.115.43.54.6658.19.29.711.013113112.4.3.41.1-.1-.4-.4.0-1.81.7-.96.97.810.011.612.313.114.517 018.818.04.56.59911.711.712.315.115 417.712,810.714.720 222 722.222.825.823 024 517.919501951 ....1952195319541955195619571958195933.138.337.834 434.233.534.034 839 037.928.532.932.531.029.829.530.429.733.533.616.119.618.216.916.316.016.417.419.218.912.413.214.314.113.613.514.012 314.214.7.81.2.9-.6.5.2~.s.8.019.522.322.821.521.822.222.723.725.827.213.615.915.013.012.411.311.311.113.210.718.920.518.816.215.414.113.813.115.212.319601961196219631964196519661967..1968196938 940 542.343.442.346.550 550 551.856,434.235.236.537.537.339.443.442.844.248,219.019.520.220.019.921.925.024.425.528.615315716.317.417.417.518 418.418.719.6.4.3.6.6-.81.0-.1.7.1.127.428.630.331.631.833.736.538.239.542.111.512.012.111.810.512.914.012.312.314.313 013 313.312.811.313.714.412.311.813.0197019711972197319741975197619771978197958.762 071.098.898.01010101.9108.6127 3151.350.552.761.186.992.488.995.496.2112.5131.729.530.535.645.841.343.146.347.658.868.621.022 325.541.151.145 849.048.653 763.1.01.4.93.4-1.63.4-2.41.01.15.644,447.252.165.472.075.883.390.2100.6119.014.214.818.933.426.025.218.718.426.732.412.212.215.125.117.615.611.010.213.614.91980 . ...19811982"150 6166.8163.7139.5143.5142.967.868.569.071775.073.9-4.35.5-.2130.5141.6144.220.125.119.58.29.26.71980:1||IllIV148.6145 2153 2155.4135.3134.3143.6144.866.764.469.370.868.669 974 374.0-1.4-4.2-6.0-5.6125.7128.7132.0135.422.916.521.220.09.56.88.57.81981.1IIIllIV161.8164 71715168.8142.5142.3146 7142.567.969.471.065.774.672 975 776.82.55.37.27.0139.0141.0143.2143.222.823.728.325.68.68.810.29.11982:||| ...HIIV162.0163 0161.6168.1143.4144.4143.2140.667.470.170.468.176.074 372.872.5-1.0-.5.0.5143.7144.2144.3144.618.318.817.323.56.56.65.98.0J Cash marketing receipts and inventory changes plus Government payments, o<strong>the</strong>r farm cash income, and nonmoney incomefurnished by farms.2 Physical changes in end-<strong>of</strong>-period inventory <strong>of</strong> crop and livestock commodities valued at average prices during <strong>the</strong> period.3 Income in current dollars divided by <strong>the</strong> consumer price index (Department <strong>of</strong> Labor).Source: Department <strong>of</strong> Agriculture, except as noted.269
- Page 5:
CONTENTSPageECONOMIC REPORT OF THE
- Page 9 and 10:
ECONOMIC REPORT OF THE PRESIDENTTo
- Page 11 and 12:
Monetary policy will play a critica
- Page 13 and 14:
Interest Rates and the U.S. Trade D
- Page 15:
THE ANNUAL REPORTOF THECOUNCIL OF E
- Page 19 and 20:
CONTENTSPageCHAPTER 1. FROM RECESSI
- Page 21 and 22:
PageConclusions 122CHAPTER 6. REVIE
- Page 23 and 24:
CHAPTER 1From Recession to Recovery
- Page 25 and 26:
slowed somewhat in the 1970s regard
- Page 27 and 28:
nal GNP growth is reflected in a sl
- Page 29 and 30:
inflation. More specifically, the A
- Page 31 and 32:
inflation rate, or with a 12 percen
- Page 33 and 34:
1988, an increase of about one-four
- Page 35 and 36:
CHAPTER 2The Dual Problems of Struc
- Page 37 and 38:
frequently associated with poor hea
- Page 39 and 40:
Chart 2-2Distribution of Unemployme
- Page 41 and 42:
Chart 2-4Distribution of Unemployme
- Page 43 and 44:
These findings suggest several conc
- Page 45 and 46:
Wage RigidityA number of studies sh
- Page 47 and 48:
that these measures may have caused
- Page 49 and 50:
Most young people find jobs or leav
- Page 51 and 52:
to employers who hire youths. Tax c
- Page 53 and 54:
defined broadly to include individu
- Page 55 and 56:
ship between incomplete experience
- Page 57 and 58:
CHAPTER 3The United States in the W
- Page 59 and 60:
with 2.6 percent in the other Organ
- Page 61 and 62:
TABLE 3-1 .—Structure ofthe U.S.
- Page 63 and 64:
TABLE 3-2.—Trade balances by comm
- Page 65 and 66:
concentrate on doing what it does r
- Page 67 and 68:
the United States will depress pric
- Page 69 and 70:
Chart 3-3Real Exchange Rates Of Maj
- Page 71 and 72:
AN UNDERVALUED YEN?The explanations
- Page 73 and 74:
arily reduced the international com
- Page 75 and 76:
nancial markets. These transactions
- Page 77 and 78:
TABLE 3-6.—Economic performance b
- Page 79 and 80:
were undoubtedly a highly favorable
- Page 81 and 82:
of lenders that some debtors will n
- Page 83 and 84:
CHAPTER 4Increasing Capital Formati
- Page 85 and 86:
ate of net investment was required,
- Page 87 and 88:
able share in Japan and 56 percent
- Page 89 and 90:
During the 1970s, productivity grow
- Page 91 and 92:
MEASURING NATIONAL SAVINGDomestic s
- Page 93 and 94:
TAX RULES AND PERSONAL SAVINGMany e
- Page 95 and 96:
on consumption taxation might also
- Page 97 and 98:
Nevertheless, a number of economic
- Page 99 and 100:
tion permitted businesses to deprec
- Page 101 and 102:
A final problem under current tax l
- Page 103 and 104:
fleeted efforts to deal with proble
- Page 105 and 106:
egulation was probably not applicab
- Page 107 and 108:
Aeronautics Board, for example, the
- Page 109 and 110:
system resulted. Price controls, wh
- Page 111 and 112:
NGPA, both controlled and decontrol
- Page 113 and 114:
Price and allocation controls only
- Page 115 and 116:
nications industries through the re
- Page 117 and 118:
Several major pieces of legislation
- Page 119 and 120:
tempt to set cartel rates would be
- Page 121 and 122:
computer information and advertisin
- Page 123 and 124:
of computer technology to the payme
- Page 125 and 126:
trend by widening the sources and u
- Page 127 and 128:
changes. That is, members can arbit
- Page 129 and 130:
ceived to be a consequence of exces
- Page 131 and 132:
lowest point in the post-World War
- Page 133 and 134:
ing. Partly in response to the drop
- Page 135 and 136:
Chart 6-3Ratio of Consumer Installm
- Page 137 and 138:
Chart 6-4RATIO1.85Real Inventory/Sa
- Page 139 and 140:
percent increase in real defense pu
- Page 141 and 142:
8.8 percent in 1981. These declines
- Page 143 and 144:
housing. Borrowing by the nonfinanc
- Page 145 and 146:
orous competitor for credit as usur
- Page 147 and 148:
1982 their share had risen to over
- Page 149 and 150:
TABLE 6-9.—Economic outlook for 1
- Page 151:
A critical element in achieving hea
- Page 155 and 156:
LETTER OF TRANSMITTALCOUNCIL OF ECO
- Page 157 and 158:
Report to the President on the Acti
- Page 159 and 160:
ety of interagency and internationa
- Page 161:
ence J. Kotlikoff (Yale University)
- Page 165 and 166:
CONTENTSNATIONAL INCOME OR EXPENDIT
- Page 167 and 168:
B-70. Mortgage debt outstanding by
- Page 169 and 170:
NATIONAL INCOME OR EXPENDITURETABLE
- Page 171 and 172:
TABLE B-2.—Gross national product
- Page 173 and 174:
19291933193919401941194219431944194
- Page 175 and 176:
TABLE B-5.—Changes in GNP and GNP
- Page 177 and 178:
TABLE B-7.—Gross national product
- Page 179 and 180:
TABLE B-9.—Gross national product
- Page 181 and 182:
TABLE B-ll.—Gross national produc
- Page 183 and 184:
TABLE B-13.—Output, costs, and pr
- Page 185 and 186:
TABLE B-14.—Personal consumption
- Page 187 and 188:
TABLE B-16.—Gross and net private
- Page 189 and 190:
TABLE B-18.—Inventories and final
- Page 191 and 192:
TABLE B-20.—Relation of national
- Page 193 and 194:
TABLE B-21.—National income by ty
- Page 195 and 196:
TABLE B-22.—Sources of personal i
- Page 197 and 198:
TABLE B-24.—Total and per capita
- Page 199 and 200:
Year or quarterTotalTotalTABLE B-26
- Page 201 and 202:
POPULATION, EMPLOYMENT, WAGES, AND
- Page 203 and 204:
TABLE B-29.—Noninstitutional popu
- Page 205 and 206:
TABLE B-31.—Selected employment a
- Page 207 and 208:
TABLE B-33.—Civilian unemployment
- Page 209 and 210:
TABLE B-35.—Unemployment by reaso
- Page 211 and 212:
TABLE B-37.— Wage and salary work
- Page 213 and 214:
TABLE B-39.—Average weekly earnin
- Page 215 and 216:
TABLE B-41.—Changes in productivi
- Page 217 and 218:
TABLE B-43-—Industrial production
- Page 219 and 220:
TABLE B-45.—Capacity utilization
- Page 221 and 222:
TABLE B-46.—New construction acti
- Page 223 and 224: TABLE B-48.—Nonfarm business expe
- Page 225 and 226: TABLE B-50.—Manufacturers' shipme
- Page 227 and 228: Year or monthAllitemsPRICESTABLE B-
- Page 229 and 230: TABLE B-53.—Consumer price indexe
- Page 231 and 232: TABLE B-55.—Changes in consumer p
- Page 233 and 234: TABLE B-57.—Producer price indexe
- Page 235 and 236: TABLE B-58.—Producer price indexe
- Page 237 and 238: TABLE B-59.—Producer price indexe
- Page 239 and 240: MONEY STOCK, CREDIT, AND FINANCETAB
- Page 241 and 242: TABLE B-63.—Commercial bank loans
- Page 243 and 244: TABLE B-64.—Total funds raised in
- Page 245 and 246: TABLE B-66.—Aggregate reserves of
- Page 247 and 248: TABLE B-67 .—Bond yields and inte
- Page 249 and 250: TABLE B-69.—Consumer installment
- Page 251 and 252: TABLE B-71-—Mortgage debt outstan
- Page 253 and 254: TABLE B-72.—Federal budget receip
- Page 255 and 256: TABLE B-74.—Relation of Federal G
- Page 257 and 258: TABLE B-76.—Federal Government re
- Page 259 and 260: TABLE B-78.—State and local gover
- Page 261 and 262: TABLE B-80.—Estimated ownership o
- Page 263 and 264: CORPORATE PROFITS AND FINANCETABLE
- Page 265 and 266: Year or quarterTABLE B-84.—Corpor
- Page 267 and 268: TABLE B-86.—Relation of profits a
- Page 269 and 270: TABLE B-88.—Determinants of busin
- Page 271 and 272: TABLE B-9Q.~Current assets and liab
- Page 273: TABLE B-92.—Common stock prices a
- Page 277 and 278: TABLE B-96.—Farm input use, selec
- Page 279 and 280: TABLE B-98.—U.S. exports and impo
- Page 281 and 282: INTERNATIONAL STATISTICSTABLE B-100
- Page 283 and 284: TABLE B-101.—U.S. international t
- Page 285 and 286: TABLE B-103.—U.S. merchandise exp
- Page 287 and 288: TABLE B-105.—International invest
- Page 289 and 290: TABLE B-107.— World trade balance
- Page 291 and 292: TABLE B-109.—Growth rates in real
- Page 293: TABLE B-lll.—Unemployment rate, a