

Economic Report of the President
Report - The American Presidency Project
Report - The American Presidency Project
- No tags were found...

You also want an ePaper? Increase the reach of your titles
YUMPU automatically turns print PDFs into web optimized ePapers that Google loves.
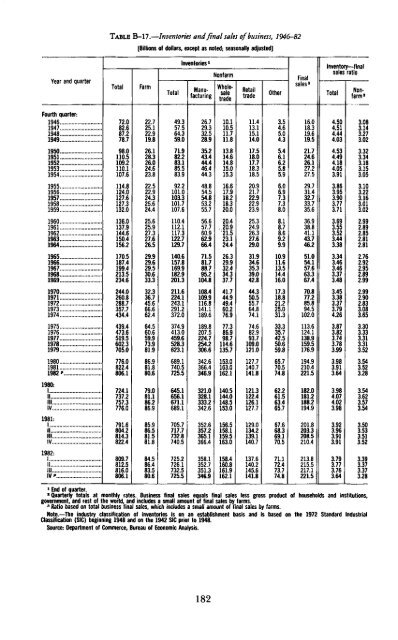
TABLE B-17.—Inventories and final sales <strong>of</strong> business, 1946-82[Billions <strong>of</strong> dollars, except as noted; seasonally adjusted]Inventories 1HonfarmYear and quarterTotal FarmTotalManufacturingWholesaletradeFourth quarter:194672.0 22 7 49.3 26 7 10.1194782.6 25.1 57.5 29.3 10.5194887.2 22 9 64.3 32.5 11.7194978.7 19.8 59.0 28.9 11.8195098 0 261 719 35 2 13.81951110.5 28.3 82.2 43.4 14.61952109 2 260 83.1 44 4 14.81953110.1 24.6 85.5 46.4 15.01954107.6 23.8 83.9 44.3 15.31955114 8 22 5 92.2 48 8 16.61956124.0 22.9 101.0 54.5 17.91957127 6 24 3 103.3 548 18.21958127.3 25.6 101.7 53.2 18.31959132.0 24.4 107.6 55.7 20.0I960136 0 25 6 1104 56 6 2041961137.9 25.9 112.1 57.7 , 20.91962144 6 27 3 117 3 60 9 21.51963150.4 27.6 122.7 62.9 23.11964156.2 26.5 129.7 66.4 24.41965170.5 29.9 140.6 71.5 26.31966187.4 296 157.8 817 29.91967199.4 29.5 169.9 88.7 32.41968213.5 306 1829 952 34.31969234.6 33.3 201.3 104.8 37.71970244.0 32.3 211.6 108.4 41.71971260.8 36.7 224.1 109.9 44.91972288 7 45 6 2431 116 8 4941973357.7 66.6 291.2 141.1 60.21974434.4 62.4 372.0 189.6 76.91975439.4 64 5 374.9 189 8 77.31976473 6 606 4130 207 5 86 91977519.5 59.9 459.6 224.7 98.71978602 3 739 528 3 254 2 114 61979705.0 81.9 623.1 306.6 135.71980776.0 86.9 689.1 342.6 153.01981822.4 818 740 5 366 4 163.01982 p806.1 80.6 725.5 346.9 162.11980:724.1 79.0 645.1 321.0 140.5II737 2 811 6561 3281 144 0Ill757.3 86.2 671.1 333.2 148.5IV776.0 86.9 689.1 342.6 153.01981:791.6 85.9 705.7 352.6 156.5•I804.2 86.5 717.7 357.2 158.1III814.3 81.5 732.8 365.1 159.5IV822.4 81.8 740.5 366.4 163.01982:| 809.7 84.5 725.2 358.1 158.4|| 812.5 86.4 726.1 352.7 160.8111816.0 83.5 732.5 351.3 161.9IV P 806.1 80.6 725.5 346.9 162.1Retailtrade11.413.115.114.017 518.017.718.318.520.921.722.922.923.925 324.926 327.629.031.934.635.339042.844.350.555 764.874.174 682 993.71090121.0127.7140 7141.8121.3122 4126.1127J129.0134.2139.1140.7137.6140.2145.6141.8O<strong>the</strong>r3.54.65.04.35.46.16.25.85.96.06.97.37.38.08.18.78.69.29.910.911.613.514.416.017.318.821225.031.333.335742.550.659.865.770.574.862.261563.465.767.668.369.170.571.172.473.774.8Finalsales •16018.319.619.521724.626,127.227.529.731.432.733.735.636938.841143.746.251.054.157.663 367.470.877.285 894.5102.0113.61241138.9159 5176.9194.92104221.5182.01812188.2194.9201.8203.3208.5210.4213.8215.5217.1221.5Inventory—finalsales ratioTotal4,504.514.444.034.534.494.184.053.913.863.953.903.773.713.693.553 523.443.383.343.463.463.373.483.453.383.373.794.263.873.823.743.783.993.983.913.643.984.074.023.983.923.963.913.913.793.773.763.64Nonfarm31 End <strong>of</strong> quarter.8 Quarterly totals at monthly rates. Business final sales equals final sales less gross product <strong>of</strong> households and institutions,government, and rest <strong>of</strong> <strong>the</strong> world, and includes a small amount <strong>of</strong> final sales by farms.3 Ratio based on total business final sales, which includes a small amount <strong>of</strong> final sales by farms.Note.—The industry classification <strong>of</strong> inventories is on an establishment basis and is based on <strong>the</strong> 1972 Standard IndustrialClassification (SIC) beginning 1948 and on <strong>the</strong> 1942 SIC prior to 1948.Source: Department <strong>of</strong> Commerce, Bureau <strong>of</strong> <strong>Economic</strong> Analysis.3 083.143 273.023 323.343183.153.053103.223163.013.022992.892 852.812.812.762.922.952 892.992.992.902833.083.653.303 333.313.313.523.543.523.283.543 623.573.543.503.533.513.523.393.373.373.28182


