TABLE B-47.—New bousing units started and authorized, 1959-82[Thousands <strong>of</strong> units]Year or monthPrivate and public 1Total(farm andnonfarm)NonfarmNew housing units startedTotalPrivate (farm and nonfarm)»1 unitType <strong>of</strong> structure2 to 4units5 unitsor moreNew private housing units authorized 2Total1 unitType <strong>of</strong> structure2 to 4units5 unitsor more1959196019611962..,.1963..,.1964....1965....1966....1967....1968....1969....1970....1971....1972197319741975....197619771978....197919801981....1982"..1981:JanFebMarAprMayJuneJulyAugSeptOctNovDec1982:JanFebMarAprMayJuneJulyAugSeptOctNovDec P.....1,553.71,296.11,365.01,492.51,634.91,561.01,509.71,195.81,321.91,545.41,499.51,469.02,084.52,378.52,057.51,352.51,171.41,547.62,001.72,036.11,760.01,312.61,100.31,070.485,272.5108.9124.0110.6107.0101.087.390.988.264.959.747.652.078.785.199.291.8107.297.2108.3111.7111.981.71,531.31,274.01,336.81,468.71,614.81,534.01,487.51,172.81,298.81,521.41,482.31,517.01,252.21,313.01,462.91,603.21,528.81,472.81,164.91,291.61,507.61,466.81,433.62,052.22,356.62,045.31,337.71,160.41,537.51,987.12,020.31,745.11,292.21,084.21,060.61,5851,2941,3181,3011,1721,0461,0409468998548608828859459318821,0669081,1931,0331,1291,1261,4041,2221,234.0994.7974.3991.41,012.4970.5963.7778.6843.9899.4810.6812.91,151.01,309.21,132.0892.21,162.41,450.91,433.31,194.1852.2705.4661.0974835863868776705696614623507554550592568621566631621628645677701883800283.0257.4338.7471.5590.8108.4 450.086.661.171.680.985.084.8120.3141.3118.368.164.085.9121.7125.0122.0109.591.180.7422.5325.1376.1527.3571.2535.9780.9906.2795.0381.6204.3289.2414.4462.0429.0330.5287.7319.01,208.3998.01,064.21,186.61,334.71,285.81,239.8971.91,141.01,353.41,323.71,351.51,924.62,218.91,819.51,074.4939.21,296.21,690.01,800.51,551.81,190.6985.5992.5Seasonally adjusted annual rates139114108971058988766278817470846764868310288926479864723453473362912522562562142692252582232932432523492044633003603614423361,2361,1961,1721,1861,1789869418788357387437978037928518799449291,0628881,0031,1721,1921,291938.3746.1722.8716.2750.2720.1709.9563.2650.6694.7625.9646.8906.11,033.1882.1643.8675.5893.61,126.11,182.6981.5710.4564.3540.071269968668265957354350545640041345445043646045048851650049756165172973277.164.667.687.1118.9100.884.861.073.084.385.288.1132.9148.6117.064.363.993.1121.3130.6125.4114.5101.888.613911511312311210998918185788868758176102918583968696111192.9187,4273.8383.3465.6464.9445.1347.7417.5574.4612.7616.7885.71,037.2820.5366.2199.8309.5442.7487.3444.8365.7319.4363.91 Units in structures built by private developers for sale upon completion to local public housing authorities under <strong>the</strong> Department <strong>of</strong>Housing and Urban Development "Turnkey" program are classified as private housing. Military housing starts, including those financedwith mortgages insured by FHA under Section 803 <strong>of</strong> <strong>the</strong> National Housing Act, are included in publicly owned starts and excluded fromtotal private starts.2 Authorized by issuance <strong>of</strong> local building permit: in 16,000 permit-issuing places beginning 1978; in 14,000 places for 1972 77; in13,000 places for 1967=71; in 12,000 places for 1963-66; and < in 10,000 places prior to 1963.» Not available separately beginning January 1970.Source: Department <strong>of</strong> Commerce, Bureau <strong>of</strong> <strong>the</strong> Census.385382373381407304300282298253252255285281310353354322477308346435367448216
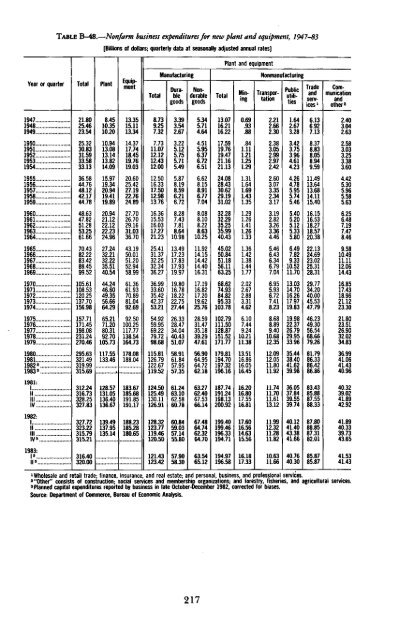
TABLE B-48.—Nonfarm business expenditures for new plant and equipment, 1947-83[Billions <strong>of</strong> dollars; quarterly data at seasonally adjusted annual rates]Plant and equipmentYear or quarterTotalPlantTotalManufacturingPnuintquipmentDurablegoodsNondurablegoodsTotalNonmanufacturingMiningTransportationPublicutilitiesTradeandservices1Communicationando<strong>the</strong>r 2194719481949..195019511952...1953195419551956195719581959218025.4623.5425.3230.83315933.5833.1336 5844.7648.1242.1744.788.4510.3510.2010.9413.0813.1413.8214.0915 9719.3420.9419.4119.89133515.1113.3414 3717.74184519.7619.0320 6025.4227.1922.7624.898.739.257.327.7311.0712.1212.4312.0012 5016.3317.5012.9813.763393.542.673 225.125 755.715.495 878.198.596.216.725345.714.644.515.956376.726.516 628.158.916.777.0413.0716.2116.2217.5919.7619.4721.1621.1324.0828.4330.6229.1931.020 69.93.88841.111211.251.291311.641.691.431.352 212.662.302 383.052 992.972.422 603.073.352.343.171.642.673.283.423.753.964.614.234 264.785.955.745.466136.927.138 378.838058.949.59114913.6413.6814.1115.402 403.042.632 583.033 253.383.604 425 305.965.585.63I960196119S219631964..1965196619671968196948 6347.82512853.2561.6670 4382.2283 4288.4599.5220.9421.1222.1222.2324.9627 2432.2132 2235.5140.5427 7026.70291631.0336.70431950.01512052.9458.9916.3615.5316.0317.2721.23254131.3732 2532.3436.278 287.437 818.6410.9813 4917.2317 8317.9319.978.088.108.228.6310.25119214.1514 4214.4016.3132.2832.2935.2535.9940.4345.0250.8451.1856.1163.251.291.261411.261.331361.421381.441.773.192.823.263.364.465 466.436346.797.045.405.205.125.335.806.497.829.3310.5211.70161516.53182718.5720.38221324.6923 0225.3128.316 256.487197.478.469 5810.49111112.0614.431970197119721973197419751976197719781979105 61108.53120 25137.70156.98157.7117145198.0823124270.4644 2446.6049 3556.6664.2965.21712080.3192 70105.736136619370 8981.0492.6992 50100 25117.77138 54164.7336 9933.6035 4242.3753.2154.9259 9569.2279 7298.6819 8016 7818 2222.7527.4426 3328 4734.04404351.07171916.8217 2019.6225.7628.59314735.1839 2947.6168 6274.9384 8295.33103.78102.79111.50128.87151.52171.772 022.672 883.314.626.107449.24102111.386955.936 727.418.238.688.899.4010.6812.3513.0314.7016.2617.9719.8319.9822.3726.7929.9533.9629 7734.20400045.5347.7946.2349.3056.5468.6679.2616 8517.43189621.1223.3021.8023.5126.9032.0234.83198019811982 31983 3295.63321.49319.99315.69117.55133.46178.08188 04115.81126.79122.67119.5258.91618457.9557.3556.9064.9564.7262.18179.81194.70197.32196.1613.5116.8616.0516.4512.0912.0511.8011.9235.4438.4041.6239.9881.7986.3386.4286.8636.9941.0641.4340.961981:||IIV312 24316 73328 25327.83128.5713105136 40136.67183 67185 6819185191.17124 50125 4913011126.916124631062 5860.7863 2762 4067 5366.14187.74191.24198.13200.9216 20168017 5516.8111.7411.7011.6113.1236.0537.8439.5539.7483.4385.8887.5588.3340.3239.0241.8942.921982:IIII327 72323.22315.79315.21139 49137.95135.14188 23185.28180.6512832123.77119.46120.5060 8459.0357.1455.8067 4864.7462.3264.70199.40199.46196.33194.7117.6016.5614.6315.5611.9912.3211.2811.8240.1241.4043.3841.6687.8088.8587.3182.0141.8940.3339.7343.651983:I sII 331640320.0012143123.4257 9058.3063 5465.12194.97196.5816.1817.3310.6311.6640.7640.3085.8785.8741.5341.431 Wholesale and retail trade; finance, insurance, and real estate; and personal, business, and pr<strong>of</strong>essional services.2 "O<strong>the</strong>r" consists <strong>of</strong> construction; social services and membership organizations; and forestry, fisheries, and agricultural services.3 Planned capital expenditures reported by business in late October-December 1982, corrected for biases.Source: Department <strong>of</strong> Commerce, Bureau <strong>of</strong> <strong>Economic</strong> Analysis.217
- Page 5:
CONTENTSPageECONOMIC REPORT OF THE
- Page 9 and 10:
ECONOMIC REPORT OF THE PRESIDENTTo
- Page 11 and 12:
Monetary policy will play a critica
- Page 13 and 14:
Interest Rates and the U.S. Trade D
- Page 15:
THE ANNUAL REPORTOF THECOUNCIL OF E
- Page 19 and 20:
CONTENTSPageCHAPTER 1. FROM RECESSI
- Page 21 and 22:
PageConclusions 122CHAPTER 6. REVIE
- Page 23 and 24:
CHAPTER 1From Recession to Recovery
- Page 25 and 26:
slowed somewhat in the 1970s regard
- Page 27 and 28:
nal GNP growth is reflected in a sl
- Page 29 and 30:
inflation. More specifically, the A
- Page 31 and 32:
inflation rate, or with a 12 percen
- Page 33 and 34:
1988, an increase of about one-four
- Page 35 and 36:
CHAPTER 2The Dual Problems of Struc
- Page 37 and 38:
frequently associated with poor hea
- Page 39 and 40:
Chart 2-2Distribution of Unemployme
- Page 41 and 42:
Chart 2-4Distribution of Unemployme
- Page 43 and 44:
These findings suggest several conc
- Page 45 and 46:
Wage RigidityA number of studies sh
- Page 47 and 48:
that these measures may have caused
- Page 49 and 50:
Most young people find jobs or leav
- Page 51 and 52:
to employers who hire youths. Tax c
- Page 53 and 54:
defined broadly to include individu
- Page 55 and 56:
ship between incomplete experience
- Page 57 and 58:
CHAPTER 3The United States in the W
- Page 59 and 60:
with 2.6 percent in the other Organ
- Page 61 and 62:
TABLE 3-1 .—Structure ofthe U.S.
- Page 63 and 64:
TABLE 3-2.—Trade balances by comm
- Page 65 and 66:
concentrate on doing what it does r
- Page 67 and 68:
the United States will depress pric
- Page 69 and 70:
Chart 3-3Real Exchange Rates Of Maj
- Page 71 and 72:
AN UNDERVALUED YEN?The explanations
- Page 73 and 74:
arily reduced the international com
- Page 75 and 76:
nancial markets. These transactions
- Page 77 and 78:
TABLE 3-6.—Economic performance b
- Page 79 and 80:
were undoubtedly a highly favorable
- Page 81 and 82:
of lenders that some debtors will n
- Page 83 and 84:
CHAPTER 4Increasing Capital Formati
- Page 85 and 86:
ate of net investment was required,
- Page 87 and 88:
able share in Japan and 56 percent
- Page 89 and 90:
During the 1970s, productivity grow
- Page 91 and 92:
MEASURING NATIONAL SAVINGDomestic s
- Page 93 and 94:
TAX RULES AND PERSONAL SAVINGMany e
- Page 95 and 96:
on consumption taxation might also
- Page 97 and 98:
Nevertheless, a number of economic
- Page 99 and 100:
tion permitted businesses to deprec
- Page 101 and 102:
A final problem under current tax l
- Page 103 and 104:
fleeted efforts to deal with proble
- Page 105 and 106:
egulation was probably not applicab
- Page 107 and 108:
Aeronautics Board, for example, the
- Page 109 and 110:
system resulted. Price controls, wh
- Page 111 and 112:
NGPA, both controlled and decontrol
- Page 113 and 114:
Price and allocation controls only
- Page 115 and 116:
nications industries through the re
- Page 117 and 118:
Several major pieces of legislation
- Page 119 and 120:
tempt to set cartel rates would be
- Page 121 and 122:
computer information and advertisin
- Page 123 and 124:
of computer technology to the payme
- Page 125 and 126:
trend by widening the sources and u
- Page 127 and 128:
changes. That is, members can arbit
- Page 129 and 130:
ceived to be a consequence of exces
- Page 131 and 132:
lowest point in the post-World War
- Page 133 and 134:
ing. Partly in response to the drop
- Page 135 and 136:
Chart 6-3Ratio of Consumer Installm
- Page 137 and 138:
Chart 6-4RATIO1.85Real Inventory/Sa
- Page 139 and 140:
percent increase in real defense pu
- Page 141 and 142:
8.8 percent in 1981. These declines
- Page 143 and 144:
housing. Borrowing by the nonfinanc
- Page 145 and 146:
orous competitor for credit as usur
- Page 147 and 148:
1982 their share had risen to over
- Page 149 and 150:
TABLE 6-9.—Economic outlook for 1
- Page 151:
A critical element in achieving hea
- Page 155 and 156:
LETTER OF TRANSMITTALCOUNCIL OF ECO
- Page 157 and 158:
Report to the President on the Acti
- Page 159 and 160:
ety of interagency and internationa
- Page 161:
ence J. Kotlikoff (Yale University)
- Page 165 and 166:
CONTENTSNATIONAL INCOME OR EXPENDIT
- Page 167 and 168:
B-70. Mortgage debt outstanding by
- Page 169 and 170:
NATIONAL INCOME OR EXPENDITURETABLE
- Page 171 and 172: TABLE B-2.—Gross national product
- Page 173 and 174: 19291933193919401941194219431944194
- Page 175 and 176: TABLE B-5.—Changes in GNP and GNP
- Page 177 and 178: TABLE B-7.—Gross national product
- Page 179 and 180: TABLE B-9.—Gross national product
- Page 181 and 182: TABLE B-ll.—Gross national produc
- Page 183 and 184: TABLE B-13.—Output, costs, and pr
- Page 185 and 186: TABLE B-14.—Personal consumption
- Page 187 and 188: TABLE B-16.—Gross and net private
- Page 189 and 190: TABLE B-18.—Inventories and final
- Page 191 and 192: TABLE B-20.—Relation of national
- Page 193 and 194: TABLE B-21.—National income by ty
- Page 195 and 196: TABLE B-22.—Sources of personal i
- Page 197 and 198: TABLE B-24.—Total and per capita
- Page 199 and 200: Year or quarterTotalTotalTABLE B-26
- Page 201 and 202: POPULATION, EMPLOYMENT, WAGES, AND
- Page 203 and 204: TABLE B-29.—Noninstitutional popu
- Page 205 and 206: TABLE B-31.—Selected employment a
- Page 207 and 208: TABLE B-33.—Civilian unemployment
- Page 209 and 210: TABLE B-35.—Unemployment by reaso
- Page 211 and 212: TABLE B-37.— Wage and salary work
- Page 213 and 214: TABLE B-39.—Average weekly earnin
- Page 215 and 216: TABLE B-41.—Changes in productivi
- Page 217 and 218: TABLE B-43-—Industrial production
- Page 219 and 220: TABLE B-45.—Capacity utilization
- Page 221: TABLE B-46.—New construction acti
- Page 225 and 226: TABLE B-50.—Manufacturers' shipme
- Page 227 and 228: Year or monthAllitemsPRICESTABLE B-
- Page 229 and 230: TABLE B-53.—Consumer price indexe
- Page 231 and 232: TABLE B-55.—Changes in consumer p
- Page 233 and 234: TABLE B-57.—Producer price indexe
- Page 235 and 236: TABLE B-58.—Producer price indexe
- Page 237 and 238: TABLE B-59.—Producer price indexe
- Page 239 and 240: MONEY STOCK, CREDIT, AND FINANCETAB
- Page 241 and 242: TABLE B-63.—Commercial bank loans
- Page 243 and 244: TABLE B-64.—Total funds raised in
- Page 245 and 246: TABLE B-66.—Aggregate reserves of
- Page 247 and 248: TABLE B-67 .—Bond yields and inte
- Page 249 and 250: TABLE B-69.—Consumer installment
- Page 251 and 252: TABLE B-71-—Mortgage debt outstan
- Page 253 and 254: TABLE B-72.—Federal budget receip
- Page 255 and 256: TABLE B-74.—Relation of Federal G
- Page 257 and 258: TABLE B-76.—Federal Government re
- Page 259 and 260: TABLE B-78.—State and local gover
- Page 261 and 262: TABLE B-80.—Estimated ownership o
- Page 263 and 264: CORPORATE PROFITS AND FINANCETABLE
- Page 265 and 266: Year or quarterTABLE B-84.—Corpor
- Page 267 and 268: TABLE B-86.—Relation of profits a
- Page 269 and 270: TABLE B-88.—Determinants of busin
- Page 271 and 272: TABLE B-9Q.~Current assets and liab
- Page 273 and 274:
TABLE B-92.—Common stock prices a
- Page 275 and 276:
AGRICULTURETABLE B-94.—Farm incom
- Page 277 and 278:
TABLE B-96.—Farm input use, selec
- Page 279 and 280:
TABLE B-98.—U.S. exports and impo
- Page 281 and 282:
INTERNATIONAL STATISTICSTABLE B-100
- Page 283 and 284:
TABLE B-101.—U.S. international t
- Page 285 and 286:
TABLE B-103.—U.S. merchandise exp
- Page 287 and 288:
TABLE B-105.—International invest
- Page 289 and 290:
TABLE B-107.— World trade balance
- Page 291 and 292:
TABLE B-109.—Growth rates in real
- Page 293:
TABLE B-lll.—Unemployment rate, a