

Economic Report of the President
Report - The American Presidency Project
Report - The American Presidency Project
- No tags were found...

Create successful ePaper yourself
Turn your PDF publications into a flip-book with our unique Google optimized e-Paper software.
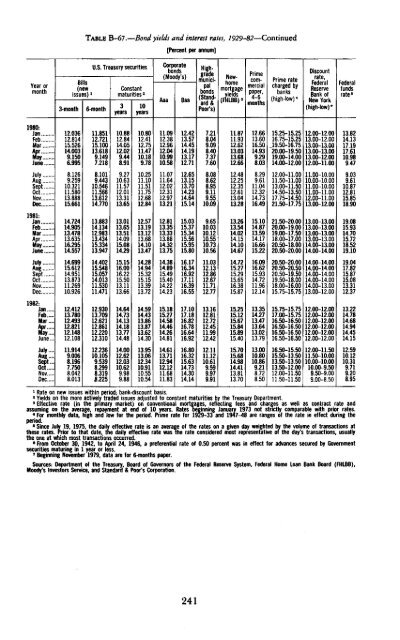
TABLE B-67 .—Bond yields and interest rates, 1929-82—Continued[Percent per annum]Year ormonth3-monthBills(newissues) 1U.S. Treasury securities6-monthConstantmaturities 23years10yearsCorporatebonds(Moody's)AaaBaaHighgrademunicipalbonds(Standard&Poor's)Newhomemortgageviews(FHLBB) 3Primecommercialpaper.monthsPrime ratecharged bybanks(high-low) 4Discountrate,FederalReserveBank <strong>of</strong>New York(high-low)*Federalfundsrate 51980:JanFebMar ...Apr.;;;; ...May.... ...June...12.03612.81415.52614.0039.1506.99511.85112.72115.10013.6189.1497.21810.8812.8414.0512.029.448.9110.8012.4112.7511.4710.189.7811.0912.3812.9612.0410.9910.5812.4213.5714.4514.1913.1712.717.218.049.098.407.377.6011.8711.9312.6213.0313.6812.6612.6613.6016.5014.939.298.0315.25-15.2516.75-15.2519.50-16.7520.00-19.5019.00-14,0014.00-12.0012.00-12.0013.00-12.0013.00-13.0013.00-13.0013.00-12.0012.00-11.0013.8214.1317.1917.6110.989.47July....Aug....Sept...OctNovDec8.1269.25910.32111.58013.88815.6618.1019.44310.54611.56613.61214.7709.2710.6311.5712.0113.3113.6510.2511.1011.5111.7512.6812.8411.0711.6412.0212.3112.9713.2112.6513.1513.7014.2314.6415.148.088.628.959.119.5510.0912.4812.2512.3512.6113.0413.288.299.6111.0412.3214.7316.4912.00-11.0011.50-11.0013.00-11.5014.50-13.5017.75-14.5021.50-17.7511.00-10.0010.00-10.0011.00-10.0011.00-11.0012.00-11.0013.00-12.009.039.6110.8712.8115.8518.901981:JanFebMartzz:June14.72414.90513.47813.63516.29514.55713.88314.13412.98313.43415.33413.94713.0113.6513.5114.0915.0814.2912.5713.1913.1213.6814.1013.4712.8113.3513.3313.8814.3213.7515.0315.3715.3415.5615.9515.809.6510.0310.1210.5510.7310.5613.2613.5414.0214.1514.1014.6715.1014.8713.5914.1716.6615.2221.50-20.0020.00-19.0019.00-17.5018.00-17.0020.50-18.0020.50-20.0013.00-13.0013.00-13.0013.00-13.0013.00-13.0014.00-13.0014.00-14.0019.0815.9314.7015.7218.5219.10JulyAugSeptOctNovDec14.69915.61214.95113.87311.26910.92614.40215.54815.05714.01311.53011.47115.1516.0016.2215.5013.1113.6614.2814.9415.3215.1513.3913.7214.3814.8915.4915.4014.2214.2316.1716.3416.9217.1116.3916.5511.0312.1312.8612.6711.7112.7714.7215.2715.2915.6516.3815.8716.0916.6215.9314.7211.9612.1420.50-20.0020.50-20.5020.50-19.5019.50-18.0018.00-16.0015.75-15.7514.00-14.0014.00-14.0014.00-14.0014.00-14.0014.00-13.0013.00-12.0019.0417.8215.8715.0813.3112.371982:JanFebMar....ApeMay,...June...12.41213.78012.49312.82112.14812.10812.93013.70912.62112.86112.22012.31014.6414.7314.1314.1813.7714.4814.5914.4313.8613.8713.6214.3015.1815.2714.5814.4614.2614.8117.1017.1816.8216.7816.6416.9213.1612.8112.7212.4511.9912.4215.2515.1215.6715.8415.8915.4013.3514.2713.4713.6413.0213.7915.75-15.7517.00-15.7516.50-16.5016.50-16.5016.50-16.5016.50-16.5012.00-12.0012.00-12.0012.00-12.0012.00-12.0012.00-12.0012.00-12.0013.2214.7814.6814.9414.4514.15July....Aug....Sept...OctNovDec11.9149.0068.1967.7508.0428.01312.23610,1059.5398.2998.3196.22514.0012.6212.0310.629.989.8813.9513.0612.3410.9110.5510.5414.6113.7112.9412.1211.6811.8316.8016.3215.6314.7314.3014.1412.1111.1210.619.599.979.9115.7015.6814.9814.4113.8113.7013.0010.8010.869.218.728.5016.50-15.5015.50-13.5013.50-13.5013.50-12.0012.00-11.5011.50-11.5012.00-11.5011.50-10.0010.00-10.0010.00-9.509.50-9.009.00-8.5012.5910.1210.319.719.208.951 Rate on new issues within period; bank-discount basis.3 Yields on <strong>the</strong> more actively traded issues adjusted to constant maturities by <strong>the</strong> Treasury Department.'Effective rate (in <strong>the</strong> primary market) on conventional mortgages, reflecting fees and charges as well as contract rate andassuming on <strong>the</strong> average, repayment at end <strong>of</strong> 10 years. Rates beginning January 1973 not strictly comparable with prior rates.«For monthly data, high and low for <strong>the</strong> period. Prime rate for 1929-33 and 1947-48 are ranges <strong>of</strong> <strong>the</strong> rate in effect during <strong>the</strong>period.6 Since July 19, 1975, <strong>the</strong> daily effective rate is an average <strong>of</strong> <strong>the</strong> rates on a given day weighted by <strong>the</strong> volume <strong>of</strong> transactions at<strong>the</strong>se rates. Prior to that date, <strong>the</strong> daily effective rate was <strong>the</strong> rate considered most representative <strong>of</strong> <strong>the</strong> day's transactions, usually<strong>the</strong> one at which most transactions occurred.8 From October 30, 1942, to April 24, 1946, a preferential rate <strong>of</strong> 0.50 percent was in effect for advances secured by Governmentsecurities maturing in 1 year or less.7 Beginning November 1979, data are for 6-months paper.Sources: Department <strong>of</strong> <strong>the</strong> Treasury, Board <strong>of</strong> Governors <strong>of</strong> <strong>the</strong> Federal Reserve System, Federal Home Loan Bank Board (FHLBB),Moody's Investors Service, and Standard & Poor's Corporation.241


