

Economic Report of the President
Report - The American Presidency Project
Report - The American Presidency Project
- No tags were found...

Create successful ePaper yourself
Turn your PDF publications into a flip-book with our unique Google optimized e-Paper software.
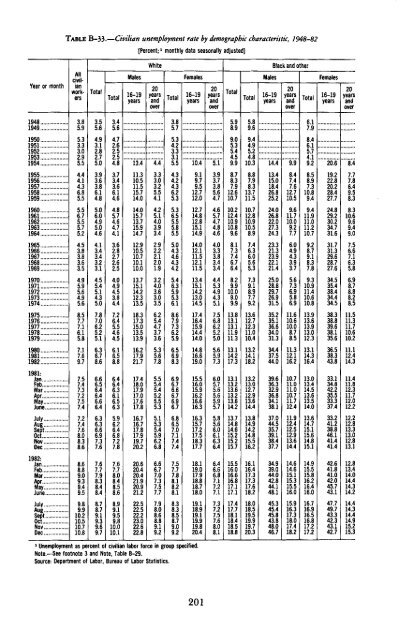
TABLE B-33.—Civilian unemployment rate by demographic characteristic, 1948-82[Percent; 1monthly data seasonally adjusted]Year or month194819491950195119521953195419551956195719581959I96019611962196319641965196619671968196919701971197219731974197519761977197819791980198119821981:JanMarAprMayJuneJulyAugSeptOctNovDec1982:JanFebMarAprMayJuneJulyAugSepto5 :NovDecAllcivilianworkers3.859533330295.54.4414.3685.55.56755575.24.5383.8363.54.9595.64.95.6857.7716.15.87.1769.77.5747372757.47274768.08.38.686889.09.394959.89910 210 510 710.8WhiteTotal3.556493.1282.75.03.9363.8614.85.0604.9504.64.13.43.43.23.14.5545.14.35.0787.0625.25.16.3678.66.66,56.464666.46.36366fi97.37.676777.98.384848.78.79.193969.7MalesTotal3.456472.625254.83.7343.6614.6485746474.13.6282.7262.54.0494.5384.4726.4554.64.561658.86464636 1656.35962646.87.27.876778.08.485868.99.1959810 010.116-19years13.411.310 511.515 714.014.015 713.715 914.712.910.510.710110.013.715114.212.313.518 317.315 013.513.916.217 921.717.418 017 917 017 617.816.716 717 817.919.720.220 620 420.421.920.921222.522.522.223.022 622.820yearsandover4.43.33.03.25.54.14.25.14.03.93.42.92.22.12.01.93.24.03.63.03.56.25.44.73.73.65.3567.85.55.45.45.25.55.35.15.35.45.96.26.86.66.77.07.37.57.77.98.08.68.89.19.2FemalesTotal3.857534.2333.15.54.3424.3625.35.3655.5585.55.04.34.64.34.25.46.35.95.36.1867.9736.25.96.5698.36.96.76.6676.96.76.86.5707.17.47.47.5777.88.18.28.18.38.38.58.79.09.216-19years10.49.19.79.512 712.012.714.812.815.114.914.012.111.512.111.513.415.114.213.014.517.416.415.914.414.014.816 619.015.516.015.916.216.616.316.315.717.217.518.317.718.119.017.918.818.718.019.118.919.119.919.820.420yearsandover5.13.9373.8564.74.6574.7484.64.03.33.83.43.44.45.34.94.35.1756.8625.25.05.6597.36.05.7565.65.95.75.85.66.06.16.36.46.4666.87.17.27.17.37.27.57.68.08.1Black and o<strong>the</strong>rTotal5.989905.3544.59.98.78.37.912 610.710.212.410.910.89.68.17.37.46.76.48.29.910.09.09.913.813.113.111.911.313.114.217.313.113.213.613.213.614.213714814.615?15?15.715.516.016.61fi817117117.417718118418*)18.8MalesTotal5.89.69.44.95.24.810.38.87.98.313.711.510.712.810.910 58.97.46.36.05.65.37.39.18.97.79.213.612.712.311.010.413.214.118.213.213.012.712.913.614.413.814.914.214 815.516.216.116.417.317.317.618.218.018.519.519.919.720.316-19years14.413.415.018.426 825.224.026 822.027 324.323.321.323.922.121.425.028.829.726.931.535.235.136.634.031.334.437.544.039.636.332.936.834.138.137.044.535.739.138.437.734.939.044.042.844.148.145.345.445.843.848.046.720yearsandover9.98.47.47.612 710.59.611.710.09.27.76.04.94.33.93.75.67.36.95.86.911.610.610.08.78.511.312.116.210.711.011.010.711.712.411.912.412.513.614.414.614.615.115.315.516.015.916.317.318.017.418.2FemalesTotal6179846.1574.19.28.5897.31089.49.411911.011210.79.2879.18.37.89.310.911.410.610.813.913.613.913.012.313.114.316.413.013.414.513.613.514.013 fi14 715 614815.114911S15.8lfi?16416016.7169Ififi18817?17.216=19years20.619.222 820.228 427.724.829 230.234 731.631.731.329.628.727.634.535.438.434.434.538.338.839.638.135.636.538.343.833.134.842.235.533.337.433.241.238.846.141.441.442.641.841.042.045.743.147.749.743.342.343.142.720yearsandover8.47.77864958.38310 694907.56671635.86.9878.88?8.511 511 311710.610.211 114 311411.81171??1??13313,013.113414.014414 314?14.414 314414915?15.31 Unemployment as percent <strong>of</strong> civilian labor force in group specified.Note.—See footnote 3 and Note, Table B-29.Source: Department <strong>of</strong> Labor, Bureau <strong>of</strong> Labor Statistics.201


