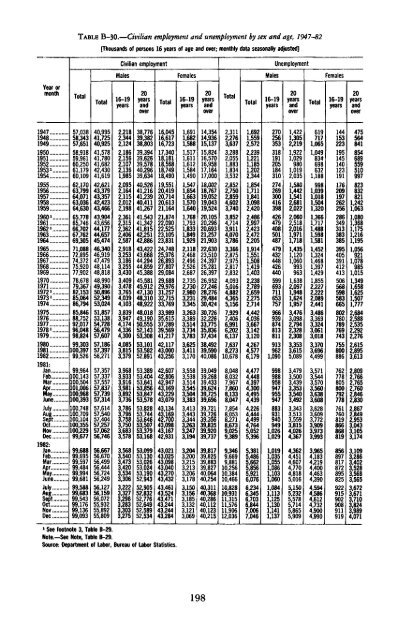
TABLE B-30.—Civilian employment and unemployment by sex and age, 1947-82[Thousands <strong>of</strong> persons 16 years <strong>of</strong> age and over; monthly data seasonally adjusted]Year ormonthCivilian employmentTotalMalesTotal16-19years20yearsandoverFemalesTotal16-19years20yearsandoverUnemploymentTotalMalesTotal16-19years20yearsandoverFemalesTotal16-1920yearsandover1947194819491950195119521953K..195419551956195719581959I960 1 .,.,19611962»....1963196419651966196719681969197019711972»...1973 >...19741975197619771978 »....19791980198119821981:JanFebMar...,May...,June..,July....Aug....fSzNov...,Dec...,1982:JanFebMar....fcJune..,July....Aug..Sept.Oct...Nov..Dec..57,03858,34357,65158,91859,96160,25061,17960,10962,17063,79964,07163,03664,63065,77865,74666,70267,76269,30571,08872,89574,37275,92077,90278,67879,36782,15385,06486,79485,84688,75292,01796,04898,82499,303100,39799,52699,964100,143100,504101,006100,968100,393100,748100,709100,104100,355100,22999,67799,68899,69599,59799,48499,99499,68199,58899,68399,54399,17699,13699,09340,99541,72540,92541,57841,78041,68242,43041,61942,62143,37943,35742,42343,46643,90443,65644,17744,65745,47446,34046,91947,47948,11448,81848,99049,39050,89652,34953,02451,85753,13854,72856,47957,60757,18657,39756,27157,35757,33757,55757,83757,73957,31457,61457,54057,40457,25757,06256,74656,66756,67056,49956,44456,72456,24956,12756,15956,07255,93255,89255,8092,2182,3442,1242,1862,1562,1072,1361,9852,0952,1642,1152,0122,1982,3612,3152,3622,4062,5872,9183,2533,1863,2553,4303,4093,4783,7654,0394,1033,8393,9474,1744,3364,3004,0853,8153,3793,9683,9333,9163,9813,8923,7363,7863,7963,7583,7503,6833,5783,5683,5403,4733,4203,5343,3063,2223,3273,2963,2833,3033,27538,77639,38238,80339,39439,62639,57840,29639,63440,52641,21641,23940,41141,26741,54341,34241,81542,25142,88643,42243,66844,29444,85945,38845,58145,91247,13048,31048,92248,01849,19050,55552,14353,30853,10153,58252,89153,38953,40453,64153,85653,84753,57853,82853,74453,64653!50753,37953,16853,09953,13053,02653,02453,19052,94352,90552,83252,77652,64952,58952,53416,04516,61716,72317,34018,18118,56818,74918,49019,55120,41920,71420,61321,16421,87422,09022,52523,10523,83124,74825,97626,89327,80729,08429,68829,97631,25732,71533,76933,98935,61537,28939,56941,21742,11743,00043,25642,60742,80642,94743,16943,22943,07943,13443,16942,70043,09843,16742,93143,02143,02543,09843,04043,27043,43243,46143,52443,47143,24443,24443,2841,6911,6821,5881,5171,6111,6121,5841,4901,5471,6541,6631,5701,6401,7681,7931,8331,8491,9292,1182,4682,4962,5262,6872,7352,7302,9803,2313,3453,2633,3893,5143,7343,7833,6253,4113,1703,5583,5383,5143,5453,5043,3833,4133,4433.3443,2633,2473,1943,2043,2003,2153,2133,2063,1783,1503,1563,1853,1323,1213,06914,35414,93615,13715,82416,57016,95817,16417,00018,00218,76719,05219,04319,52420,10520,29620,69321,25721,90322,63023,51024,39725,28126,39726,95227,24628,27629,48430,42430,72632,22633,77535,83637,43438,49239,59040,08639,04939,26839,43339,62439,72539,69639,72139,72639,35639,83539,92039,73739,81739,82539,88339,82740,06440,25440,31140,36840,28640,11240,12340,2152,3112,2763,6373,2882,0551,8831,8343,5322,8522,7502,8594,6023,7403,8524,7143,9114,0703,7863,3662,8752,9752,8172,8324,0935,0164,8824,3655,1567,9297,4066,9916,2026,1377,6378,27310,6788,0488,0327,9677,8608,1338,0477,8548,0538,2718,6739,0259,3899,3469,6699,88110,25610,38410,46610,82810,93111,31511,57611,90612,0361,6921,5592,5722,2391,2211,1851,2022,3441,8541,7111,8413,0982,4202,4862,9972,4232,4722,2051,9141,5511,5081,4191,4032,2382,7892,6592,2752>144,4424,0363,6673,1423,1204,2674^776,1794,4774,4484,3974,30044954,4394,2264,4444,4994,7645,0525,3965,3815,4865,6625,8565,9216,0766,2346,3456,7036,8447,0067,0462702563533181912051843102742693004163984264794085014874794324484264405996937116537579669398748138119139621,090958947955947883$9491,0261,0291,019L0861,1031,0601,0841,1131,1251,1301,1411,1371,4221,3052,2191,9221,0299801,0192,0351,5801,4421,5412,6812,0222,0602,5182,0161,9711,7181,4351,1201,0609939631,6382,0971,9481,6241,9573,4763,0982,7942,3282,3083,3533,6155,0893,4793,5003,4393,3533.5403,4923,3433.5133,5593,8154,0264,3674,3624,4514,6074,7704,8185,0165,1505,2325,5785,7145,8655,9096197171,0651,0498346986321,1889981,0391,0181,5041,3201,3661,7171,4881,5981.5811,4521,3241,4681,3971.4291,8552,2272,2222,0892,4413,4863,3693,3243,0613,0183,3703,6964,4993,5713,5443,5703,5603,6383:6083,6283,6093,7723,9093,9733,9933,9654,1834,2194,4004,4634,3904,5944,5864,6124,7324,9004,9901441532231951451401231911762091972622562863493133833853954053914124135065685985836658027807897697437558007627788058007927787617608198668688198568978178728958259229159029089119194755648418546895595109978238328211,2421,0631,0801,3681,1751,2161,1951,0569211,0789851,0151,3491,6581,6251,5071,7772,6842,5882,53522922,2762,6152,8953,6132,8092,7662,7652,7602,8462,8302,8672,8492,9533,0433,1053,1743,1093,2863,4023,5283,5683,5653,6723,6713,7103,8243,9894,0711 See footnote 3, Table B-29.Note.—See Note, Table B-29.Source: Department <strong>of</strong> Labor, Bureau <strong>of</strong> Labor Statistics.198
TABLE B-31.—Selected employment and unemployment data, 1948-82[Percent; monthly data seasonally adjusted]Civilian employment as percent <strong>of</strong> population 1Unemployment rate 2Year ormonthTotalBothsexes16-19yearsMales20yearsandoverFemales20yearsandoverWhiteBlackando<strong>the</strong>rAllworkersBothsexes18-19yearsBy sex and ageMales20yearsandoverFemales20yearsandoverBy selected groupsExperiencedwageandsalaryworkersMarriedmen,spousepresent»WomenwhomaintainfamiliesFulltimeworkers*Bluecollarworkers51948194955854.645543.083 981.630.730.63.85.99213.43.25.43.65.3436.83.55.4428.019501951....1952195319541955 "".19561957 .1958195955 255.755.455.353 855.156.155 754.254.843 844.944.143.940141.342.741137.638.181.981.680.880.678.880.080.880278.079.031.632.633.032.932 333.834.935.034.635.15.33.33.02.95.54.44.14.36.85.512.28.28.57.612.611.011.111615.914.64.72.52.42.5493.83.43.66.24.7514.03.22.955444.24.16.15.26.03.73.43.26.2484.44.67.35.7461.51.41.7402.62.32.85.13.6502.62.5523.83.7407.27.23.93.634 7.25.85.16.210.27.61960 .19611962196319641965196619671968196954 954.254 254.154 555.055 655.856.056.539.037.537 635.835 837.740740.440.642.178.777.677 477.377 777.977 677.477.176.935.735.535836.236937.638 639^340.041.154.054354.855 455.755.956.555.256156.857 256.956.656.75.56.7555.7524.5383.83.63.514 716.814 717.216 214.812 812.912.712.24.75.74.64.5393.2252!32.22.15.16.3545'.4524.5384.23.83.75.76.8565.6504.3353.63.43.33.74.6363.4282.4191.81.61.54.94.44.46.75.5494.235343.13.17.89.2747.3635.3424.44.13.9197019711972197319741975197619771978197956.155.556.056.957.055.356.157.158.659.241.240.442.644.845.042.343.245.147.447.776.175.375.876.375.772.973.273.774.574.741.240.841.342.242.742.343.544.746.547.656.255.756.457.357.555.956.857.959.360.055.553.853.254.053.350.451.051.553.754.04.95.95.64.95.68.57.77.16.15.815.316.916.214.516.019.919.017.816.416.13.54.44.03.33.86.85.95.24.34.24.85.75.44.95.58.07.47.06.05.74.85.75.34.55.38.27.36.65.65.52.63.22.82.32.75.14.23.62.82.85.47.37.27.17.010.010.19.48.58.34.55.55.14.45.18.17.36.65.65.36.27.46.55.46.711.79.48.16.97.019801981198258.558.357.145.843.740.872.972.370.248.048.548.359.459.358.252.451.449.87.17.69.717.819.623.25.96.38.86.46.88.36.97.39.34.24.36.59.210.411.76.97.39.610.010.34.21981:Jan....Feb....Mar...June..July...Aug...Sept..Oct....Nov...Dec...58.458.458.658.858.758.358.458.457.958.057.957.545.044.844.645.344.643.043.644.043.242.842.441.572.672.672.873.072.872.472.672.472.171.871.571.248.248.448.648.748.848.748.648.648.048.548.648.359.359.559.559.859.759.459.559.559.059.158.958.652.151.652.052.552.051.251.350.951.151.051.050.67.57.47.37.27.57.47.27.47.68.08.38.619.019.119.218.819.119.518.618.919.920.621.521.46.16.26.05.96.26.15.86.16.26.77.07.66.76.66.66.56.76.76.76.77.07.17.27.47.17.17.06.87.27.06.97.07.37.67.98.44.24.24.23.84.04.24.04.04.34.75.05.610.39.99.89.910.410.511.210.210.610.710.810.37.27.27.16.97.17.16.97.07.37.78.08.510.110.210.09.69.99.89.69.710.210.911.612.61982:Jan....Feb....Mar...May!"June..July...Aug...Sept..Oct....Nov...Dec...57.557.457.357.257.457.257.157.156.956.656.656.541.641.541.341.141.840.439.840.640.740.440.640.171.070.970.770.670.770.370.169.969.869.569.369.148.348.348.348.148.348.548.548.548.448.148.048.158.558.558.458.358.558.358.258.258.157.757.757.650.550.350.149.750.149.749.849.749.649.549.349.38.68.89.09.39.49.59.89.910.210.510.710.821.722.321.922.822.922.523.923.823.824.124.224.57.67.78.08.38.38.78.99.09.69.810.010.17.27.67.98.18.28.18.38.38.48.79.09.28.28.58.79.19.29.29.49.49.810.110.510.75.35.45.66.06.16.46.66.87.27.57.67.810.410.410.811.511.912.112.011.712.411.312.513.28.48.58.99.19.29.49.69.710.210.510.610.812.412.513.013.513.614.014.414.415.515.816.216.31 Civilian employment as percent <strong>of</strong> total noninstitutional population.2 Unemployment as percent <strong>of</strong> civilian labor force in group specified.3 Data for 1949 and 1951-54 are for April; 1950, for March.* Data for 1949-61 are for May.8 Includes craft and kindred workers, operatives, and nonfarm laborers. Data for 1948-57 are based on data for January, April, July,and October.Note—Data relate to persons 16 years <strong>of</strong> age and over. See footnote 3 and Note, Table B-29.Source: Department <strong>of</strong> Labor, Bureau <strong>of</strong> Labor Statistics.199
- Page 5:
CONTENTSPageECONOMIC REPORT OF THE
- Page 9 and 10:
ECONOMIC REPORT OF THE PRESIDENTTo
- Page 11 and 12:
Monetary policy will play a critica
- Page 13 and 14:
Interest Rates and the U.S. Trade D
- Page 15:
THE ANNUAL REPORTOF THECOUNCIL OF E
- Page 19 and 20:
CONTENTSPageCHAPTER 1. FROM RECESSI
- Page 21 and 22:
PageConclusions 122CHAPTER 6. REVIE
- Page 23 and 24:
CHAPTER 1From Recession to Recovery
- Page 25 and 26:
slowed somewhat in the 1970s regard
- Page 27 and 28:
nal GNP growth is reflected in a sl
- Page 29 and 30:
inflation. More specifically, the A
- Page 31 and 32:
inflation rate, or with a 12 percen
- Page 33 and 34:
1988, an increase of about one-four
- Page 35 and 36:
CHAPTER 2The Dual Problems of Struc
- Page 37 and 38:
frequently associated with poor hea
- Page 39 and 40:
Chart 2-2Distribution of Unemployme
- Page 41 and 42:
Chart 2-4Distribution of Unemployme
- Page 43 and 44:
These findings suggest several conc
- Page 45 and 46:
Wage RigidityA number of studies sh
- Page 47 and 48:
that these measures may have caused
- Page 49 and 50:
Most young people find jobs or leav
- Page 51 and 52:
to employers who hire youths. Tax c
- Page 53 and 54:
defined broadly to include individu
- Page 55 and 56:
ship between incomplete experience
- Page 57 and 58:
CHAPTER 3The United States in the W
- Page 59 and 60:
with 2.6 percent in the other Organ
- Page 61 and 62:
TABLE 3-1 .—Structure ofthe U.S.
- Page 63 and 64:
TABLE 3-2.—Trade balances by comm
- Page 65 and 66:
concentrate on doing what it does r
- Page 67 and 68:
the United States will depress pric
- Page 69 and 70:
Chart 3-3Real Exchange Rates Of Maj
- Page 71 and 72:
AN UNDERVALUED YEN?The explanations
- Page 73 and 74:
arily reduced the international com
- Page 75 and 76:
nancial markets. These transactions
- Page 77 and 78:
TABLE 3-6.—Economic performance b
- Page 79 and 80:
were undoubtedly a highly favorable
- Page 81 and 82:
of lenders that some debtors will n
- Page 83 and 84:
CHAPTER 4Increasing Capital Formati
- Page 85 and 86:
ate of net investment was required,
- Page 87 and 88:
able share in Japan and 56 percent
- Page 89 and 90:
During the 1970s, productivity grow
- Page 91 and 92:
MEASURING NATIONAL SAVINGDomestic s
- Page 93 and 94:
TAX RULES AND PERSONAL SAVINGMany e
- Page 95 and 96:
on consumption taxation might also
- Page 97 and 98:
Nevertheless, a number of economic
- Page 99 and 100:
tion permitted businesses to deprec
- Page 101 and 102:
A final problem under current tax l
- Page 103 and 104:
fleeted efforts to deal with proble
- Page 105 and 106:
egulation was probably not applicab
- Page 107 and 108:
Aeronautics Board, for example, the
- Page 109 and 110:
system resulted. Price controls, wh
- Page 111 and 112:
NGPA, both controlled and decontrol
- Page 113 and 114:
Price and allocation controls only
- Page 115 and 116:
nications industries through the re
- Page 117 and 118:
Several major pieces of legislation
- Page 119 and 120:
tempt to set cartel rates would be
- Page 121 and 122:
computer information and advertisin
- Page 123 and 124:
of computer technology to the payme
- Page 125 and 126:
trend by widening the sources and u
- Page 127 and 128:
changes. That is, members can arbit
- Page 129 and 130:
ceived to be a consequence of exces
- Page 131 and 132:
lowest point in the post-World War
- Page 133 and 134:
ing. Partly in response to the drop
- Page 135 and 136:
Chart 6-3Ratio of Consumer Installm
- Page 137 and 138:
Chart 6-4RATIO1.85Real Inventory/Sa
- Page 139 and 140:
percent increase in real defense pu
- Page 141 and 142:
8.8 percent in 1981. These declines
- Page 143 and 144:
housing. Borrowing by the nonfinanc
- Page 145 and 146:
orous competitor for credit as usur
- Page 147 and 148:
1982 their share had risen to over
- Page 149 and 150:
TABLE 6-9.—Economic outlook for 1
- Page 151:
A critical element in achieving hea
- Page 155 and 156: LETTER OF TRANSMITTALCOUNCIL OF ECO
- Page 157 and 158: Report to the President on the Acti
- Page 159 and 160: ety of interagency and internationa
- Page 161: ence J. Kotlikoff (Yale University)
- Page 165 and 166: CONTENTSNATIONAL INCOME OR EXPENDIT
- Page 167 and 168: B-70. Mortgage debt outstanding by
- Page 169 and 170: NATIONAL INCOME OR EXPENDITURETABLE
- Page 171 and 172: TABLE B-2.—Gross national product
- Page 173 and 174: 19291933193919401941194219431944194
- Page 175 and 176: TABLE B-5.—Changes in GNP and GNP
- Page 177 and 178: TABLE B-7.—Gross national product
- Page 179 and 180: TABLE B-9.—Gross national product
- Page 181 and 182: TABLE B-ll.—Gross national produc
- Page 183 and 184: TABLE B-13.—Output, costs, and pr
- Page 185 and 186: TABLE B-14.—Personal consumption
- Page 187 and 188: TABLE B-16.—Gross and net private
- Page 189 and 190: TABLE B-18.—Inventories and final
- Page 191 and 192: TABLE B-20.—Relation of national
- Page 193 and 194: TABLE B-21.—National income by ty
- Page 195 and 196: TABLE B-22.—Sources of personal i
- Page 197 and 198: TABLE B-24.—Total and per capita
- Page 199 and 200: Year or quarterTotalTotalTABLE B-26
- Page 201 and 202: POPULATION, EMPLOYMENT, WAGES, AND
- Page 203: TABLE B-29.—Noninstitutional popu
- Page 207 and 208: TABLE B-33.—Civilian unemployment
- Page 209 and 210: TABLE B-35.—Unemployment by reaso
- Page 211 and 212: TABLE B-37.— Wage and salary work
- Page 213 and 214: TABLE B-39.—Average weekly earnin
- Page 215 and 216: TABLE B-41.—Changes in productivi
- Page 217 and 218: TABLE B-43-—Industrial production
- Page 219 and 220: TABLE B-45.—Capacity utilization
- Page 221 and 222: TABLE B-46.—New construction acti
- Page 223 and 224: TABLE B-48.—Nonfarm business expe
- Page 225 and 226: TABLE B-50.—Manufacturers' shipme
- Page 227 and 228: Year or monthAllitemsPRICESTABLE B-
- Page 229 and 230: TABLE B-53.—Consumer price indexe
- Page 231 and 232: TABLE B-55.—Changes in consumer p
- Page 233 and 234: TABLE B-57.—Producer price indexe
- Page 235 and 236: TABLE B-58.—Producer price indexe
- Page 237 and 238: TABLE B-59.—Producer price indexe
- Page 239 and 240: MONEY STOCK, CREDIT, AND FINANCETAB
- Page 241 and 242: TABLE B-63.—Commercial bank loans
- Page 243 and 244: TABLE B-64.—Total funds raised in
- Page 245 and 246: TABLE B-66.—Aggregate reserves of
- Page 247 and 248: TABLE B-67 .—Bond yields and inte
- Page 249 and 250: TABLE B-69.—Consumer installment
- Page 251 and 252: TABLE B-71-—Mortgage debt outstan
- Page 253 and 254: TABLE B-72.—Federal budget receip
- Page 255 and 256:
TABLE B-74.—Relation of Federal G
- Page 257 and 258:
TABLE B-76.—Federal Government re
- Page 259 and 260:
TABLE B-78.—State and local gover
- Page 261 and 262:
TABLE B-80.—Estimated ownership o
- Page 263 and 264:
CORPORATE PROFITS AND FINANCETABLE
- Page 265 and 266:
Year or quarterTABLE B-84.—Corpor
- Page 267 and 268:
TABLE B-86.—Relation of profits a
- Page 269 and 270:
TABLE B-88.—Determinants of busin
- Page 271 and 272:
TABLE B-9Q.~Current assets and liab
- Page 273 and 274:
TABLE B-92.—Common stock prices a
- Page 275 and 276:
AGRICULTURETABLE B-94.—Farm incom
- Page 277 and 278:
TABLE B-96.—Farm input use, selec
- Page 279 and 280:
TABLE B-98.—U.S. exports and impo
- Page 281 and 282:
INTERNATIONAL STATISTICSTABLE B-100
- Page 283 and 284:
TABLE B-101.—U.S. international t
- Page 285 and 286:
TABLE B-103.—U.S. merchandise exp
- Page 287 and 288:
TABLE B-105.—International invest
- Page 289 and 290:
TABLE B-107.— World trade balance
- Page 291 and 292:
TABLE B-109.—Growth rates in real
- Page 293:
TABLE B-lll.—Unemployment rate, a