TABLE B-51.—Manufacturers' new and unfilled orders, 1947-82[Amounts in millions <strong>of</strong> dollars; monthly data seasonally adjusted]New orders 1Unfilled orders'Unfitted orders—shipmentsratio 3Year or monthTotalDurable goodsindustriesTotalCapitalgoodsindustries,nondefenseNondurablegoodsindustriesTotalDurablegoodsindustriesNondurablegoodsindustriesTotalDurablegoodsindustries194719481949195019511952195319541955195619571958195919601961196219631964196519661967196819691970197119721973197419751976197719781979198019811981:Jan....Feb....Mar...May...June..July...Aug...Sept..Oct....Nov...Dec...1982:Jan....Feb....Mar...fcJune..July...Aug...Sept..Oct....Nov.15,25617,69315,61420,11023,90723,20423,58622,33527,46528,36827,55927,00230,72430,23531,10433,43635,52438,35742,10046,40247,05650,68753,95052,03855,98364,16776,25987,26885,14999,543115,027131,664147,354155,738166,015164,976165,375166,240169,422170,281171,022172,089168,797167,728159,558159,460156,660154,519155,984157,198154,995156,791157,058158,588154,380156,166149,696150,3626,3888,1266,63310,16512,84112,06112,14710,76814,99615,36514,11113,29016,00315,30315,75917,37418,70920,65223,27826,17725,82528,11629,87127,38829,99835,06442,93046,85342,01951,39861,07672,41079,39479,06083,27282,52882,69983,86286,41087,39686,91187,58284,81984,45677,19378,59276,42175,06176,30977,85976,19475,71074,55076,44672,98273,26670,6076,9037,6606,7387,4448,62210,97112,67311,01112,79915,27619,44423,20323,44924,06125,06321,85724,45625,68724,48824,03924,65524,86724,31222,52824,36922,13021,71721,56022,17422,60820,33219,27820,32218,89320,27320,18320,1738,8689,5668,9819,94511,06611,14311,43911,56612,46913,00313,44813,71214,72014,93215,34516,06116,81517,70518,82320,22521,23122,57124,07924,65025,98629,10433,33040,41543,13048,14553,95159,25467,96076,67882,74382,44782,67782,37883,01382,88584,11184,50783,97983,27282,36580,86880,23979,45879,67679,33978,80381,08182,50882,14281,39882,90080,09879,75534,47330,73624,04541,45667,26675,85761,17848,26660,00467,37553,18347,37052,73245,08047,40748,57754,32766,88280,07198,401104,547109,926115,422106,158107,147121,061161,256, 191,102173,829182,499204,880261,941303,178320,977318,621322,053322,749323,054324,826327,033327,105328,861328,384327,955323,556321,574318,621318,114315,957315,639314,521310,482306,032303,235299,001295,883293,107291,12828,57926,61919,62235,43563,39472,68058,63745,25056,24163,88050,35244,55949,37342,51444,37545,96551,27063,69176,29894,575100,576105,950111,250101,566102,119114,725153,876185,560165,930174,211196,417251,663291,883310,051308,370311,146311,666312,018313,642315,597315,618317,462317,057316,841312,769311,082308,370307,877306,211305,947305,004301,194296,866294,272290,011286,706283,960281,8615,8944,1174,4236,0213,8723,1772,5413,0163,7633,4952,8312,8113,3592,5663,0322,6123,0573,1913,7733,8263,9713,9764,1724,5925,0276,3367,380515427,8988,2888,46310,27811,29510,92610,25110,90711,08411,03611,18411,43611,48711,39911,32711,11410,78710,49210,25110,2379,7469,6929,5189,2889,1668,9638,9909,1779,1479,2671 Monthly average for year and total for month.3 Seasonally adjusted, end <strong>of</strong> period.3 Ratio <strong>of</strong> unfilled orders at end <strong>of</strong> period to shipments for period; excludes industries with no unfilled orders. Annual figures relateto seasonally adjusted data for December.Note.—Data beginning 1958 are not strictly comparable with earlier data.Source: Department <strong>of</strong> Commerce, Bureau <strong>of</strong> <strong>the</strong> Census.3.423.633.873.353.093.012.782.632.692.803.103.333.813.703.853.753.653.383.313.914.193.803.343.303.623.893.793.773.803.773.713.703.703.663.683.683.703.763.763.773.903.783.763.863.713.693.673.693.633.773.724.124.274.554.003.693.543.373.133.243.373.723.954.554.404.654.504.394,063.904.635.034.573.993.924.264.634.534.594.564.534.454.444.434.374.424.424.464.554.564.594.764.624.614.714.524.514.494.554.464.664.61220
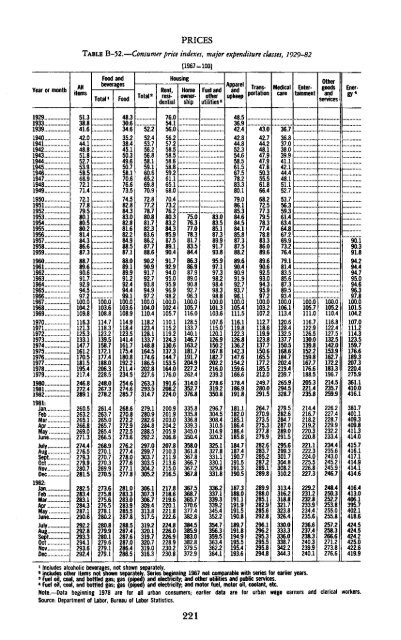
Year or monthAllitemsPRICESTABLE B-52.—Consumer price indexes, major expenditure classes, 1929-82Food andbeveragesTotal*FoodTotal 2Rent,residentialHousing[1967^100]Fuel ando<strong>the</strong>rutilities 3ApparelandupkeepMedicalcareO<strong>the</strong>rgoodsandservicesHomeownershipTransportationEntertainmentEnergy419291933 ..19391940194119421943194419451946194719481949195019511952. .1953195419551956195719581959I96019611962196319641965196619671968... .19691970197119721973.,.197419751976197719781979...198019811982..!1981:JanFebMar ....AprMayJune 1ZJulvAugilZZSeptOctNov..Dec1982:JanFebMarJuneJulyAugSeptNovDec51.338.841.642.044148.851852.753.958.566.972.171.472.177.879.580.180.580.281484.386.687.388.789.690691.792 994.597 2100.0104.2109.8116.31213125.3133.1147.7161.2170.5181.5195.4217.4246.8272.4289.1260.5263.2265.1266.8269.0271.3274.4276.5279.3279.9280.7281.5282.5283.4283.1284.3287.1290.6292.2292.8293.3294.1293.6292.4100.0103 6108.8114.7118 3123.2139.5158.7172.1177.4188.0206 3228.5248.0267.3278.22614263.7265.0265.7265.4266.5268.9270.1270.7270.3269.9270.5273.6275.8275.6276.5278.1280.2280.8279.9280.1279.6279.1279.148.330.634.635.238 445.150349.650.758.170.676.673.574.582.884.383.082.881.682 284.988.587.188.089.189991.292 494.499.1100.0103.6108.9114.9118.4123.5141.4161.7175.4180.8192.22114234.5254.6274.6285.7268.6270.8272.2272.9272.5273.6276.2277.4278.0277.6277.1277.8281.0283.3283.0283.9285.5287.8288.5287.4287.6287.0286.4286.552.252.453 756.256 858.159.160.665.269.870.972.877.278.780.881.782.383 686.287.788.690.290.991792.793 894.997 2100.0104.0110.4118.2123 4128.1133.7148.8164.5174.6186.5202 8227.6263.3293.5314.7279.1280.9282.6284.8288.5292.2297.0299.7303.7303.5304.2305.2306.1307.3306.7309.4313.8317.5319.2320.1319.7320.7319.0316.376 054.156.056257 258.558 558.658859.261165.168 070473.276280.383 284.385987.589.190.491.792.994 095.095996.998 2100.0102 4105.7110.11152119.2124.3130.6137 3144.7153.5164 0176.0191.6208.2224.0200 9201.9203.0204.2205.9206.8207.8210.3211.9213.6215.0216.5217.8218.6219.6220.1221.8222.6224.8226.0226.9228.9230.2230.875.076.377.078381.783.584.486.386.987 989.090892.796.3100.0105.7116.0128.5133.7140.1146.7163.2181.7191.7204.9227,2262.4314.0352.7376.8335.8335.8336.8339.3345.0350.4358.0361.8367.8366.7367.2367.8367.5368.7365.7370.6377.4382.8384.5385.9383.0382.8379.5372.983.083.585.187.389.991.793.895.997.197 398.298.498.398.8100.0101.3103.6107.6115.0120.1126.9150.2167.8182.7202.2216.0239.3278.6319.2350.8296.7304.5308.4310.5314.9320.2325.1327.8331.1330.1329.8331.8336.2337.1339.3339.2345.4352.2354.7356.3359.5363.4362.2364.148 536.942.442 844852.354 658.561567.578.283.380179.086.185.384.684 584.185 887.387.588.289.690.490 991.992 793.7961100.0105.4111.5116.1119 8122.3126.8136.2142.3147.6154.2159 6166.6178.4186.9191.8181.1182.0185.1186.4186.4185.8184.7187.4190.7191.5191.3190.5187.3188.0191.1191.9191.5190.8189.7191.8194.9195.5195.4193.643.042.744 248.147 947.947.850.355.561.866.468.272.577.379.578.377.478.883.386.089.689.690.692.593.094.395.997.2100.0103.2107.2112.7118.6119.9123.8137.7150.6165.5177.2185.5212.0249.7280.0291.5264.7270.9273.5275.3277.8279.9282.6283.7285.2287.2289.1289.8289.9288.0285.1282.9285.6292.8296.1296.2295.3295.5295.8294.836.736.837 038.039 941.142144.448151.152 753 756.359 361.463464.867 269.973.276.479.181.483 585.687 389.593.4100.0106.1113.4120.6128.4132.5137.7150.5168.6184.7202.4219.4239.7265.9294.5328.7279.5282.6284.7287.0289.0291.5295.6299.3301.7304.8308.2310.2313.4316.2318.8321.7323.8326.4330.0333.3336.0338.7342.2344.3100.0105.7111.0116.7122.9126.5130.0139.8152.2159.8167.7176.6188.5205.3221.4235.8214.4216.7218.2219.2220.3220.8221.1222.3224.0225.5226.8227.3229.2231.2232.8233.9234.4235.6236,6237.4238.3240.3239.9240.1100.0105.2110.4116.8122.4127.5132.5142.0153.9162.7172.2183.3196.7214.5235.7259.9226.2227.4228.7229.9232.2233.4234.4235.6243.0245.2245.9246.7248.4250.3252.2253.8255.0255.8257.2258.3266.6271.2273.8276.690.190.391.894 294 494 795 094696 397.8100.0101.5104.2107.0111.2114.3123.5159.7176.6189.3207.3220.4275.9361.1410.0416.1381.7401.1409.3409.8411.3414.0415.7416.1417.1414.9414.1414.6416.4413.0406.1395.7402.1418.6424.5424.5424.2425.0422.6419.91 Includes alcoholic beverages, not shown separately.* Includes o<strong>the</strong>r items not shown separately. Series beginning 1967 not comparable with series for earlier years.• Fuel oil, coal, and bottled gas; gas (piped) and electricity; and o<strong>the</strong>r utilities and public services.4 Fuel oil, coal, and bottled gas; gas (piped) and electricity; and motor fuel, motor oil coolant, etc.Note.—Data beginning 1978 are for all urban consumers; earlier data are for urban wage earners and clerical workers.Source: Department <strong>of</strong> Labor, Bureau <strong>of</strong> Labor Statistics.221
- Page 5:
CONTENTSPageECONOMIC REPORT OF THE
- Page 9 and 10:
ECONOMIC REPORT OF THE PRESIDENTTo
- Page 11 and 12:
Monetary policy will play a critica
- Page 13 and 14:
Interest Rates and the U.S. Trade D
- Page 15:
THE ANNUAL REPORTOF THECOUNCIL OF E
- Page 19 and 20:
CONTENTSPageCHAPTER 1. FROM RECESSI
- Page 21 and 22:
PageConclusions 122CHAPTER 6. REVIE
- Page 23 and 24:
CHAPTER 1From Recession to Recovery
- Page 25 and 26:
slowed somewhat in the 1970s regard
- Page 27 and 28:
nal GNP growth is reflected in a sl
- Page 29 and 30:
inflation. More specifically, the A
- Page 31 and 32:
inflation rate, or with a 12 percen
- Page 33 and 34:
1988, an increase of about one-four
- Page 35 and 36:
CHAPTER 2The Dual Problems of Struc
- Page 37 and 38:
frequently associated with poor hea
- Page 39 and 40:
Chart 2-2Distribution of Unemployme
- Page 41 and 42:
Chart 2-4Distribution of Unemployme
- Page 43 and 44:
These findings suggest several conc
- Page 45 and 46:
Wage RigidityA number of studies sh
- Page 47 and 48:
that these measures may have caused
- Page 49 and 50:
Most young people find jobs or leav
- Page 51 and 52:
to employers who hire youths. Tax c
- Page 53 and 54:
defined broadly to include individu
- Page 55 and 56:
ship between incomplete experience
- Page 57 and 58:
CHAPTER 3The United States in the W
- Page 59 and 60:
with 2.6 percent in the other Organ
- Page 61 and 62:
TABLE 3-1 .—Structure ofthe U.S.
- Page 63 and 64:
TABLE 3-2.—Trade balances by comm
- Page 65 and 66:
concentrate on doing what it does r
- Page 67 and 68:
the United States will depress pric
- Page 69 and 70:
Chart 3-3Real Exchange Rates Of Maj
- Page 71 and 72:
AN UNDERVALUED YEN?The explanations
- Page 73 and 74:
arily reduced the international com
- Page 75 and 76:
nancial markets. These transactions
- Page 77 and 78:
TABLE 3-6.—Economic performance b
- Page 79 and 80:
were undoubtedly a highly favorable
- Page 81 and 82:
of lenders that some debtors will n
- Page 83 and 84:
CHAPTER 4Increasing Capital Formati
- Page 85 and 86:
ate of net investment was required,
- Page 87 and 88:
able share in Japan and 56 percent
- Page 89 and 90:
During the 1970s, productivity grow
- Page 91 and 92:
MEASURING NATIONAL SAVINGDomestic s
- Page 93 and 94:
TAX RULES AND PERSONAL SAVINGMany e
- Page 95 and 96:
on consumption taxation might also
- Page 97 and 98:
Nevertheless, a number of economic
- Page 99 and 100:
tion permitted businesses to deprec
- Page 101 and 102:
A final problem under current tax l
- Page 103 and 104:
fleeted efforts to deal with proble
- Page 105 and 106:
egulation was probably not applicab
- Page 107 and 108:
Aeronautics Board, for example, the
- Page 109 and 110:
system resulted. Price controls, wh
- Page 111 and 112:
NGPA, both controlled and decontrol
- Page 113 and 114:
Price and allocation controls only
- Page 115 and 116:
nications industries through the re
- Page 117 and 118:
Several major pieces of legislation
- Page 119 and 120:
tempt to set cartel rates would be
- Page 121 and 122:
computer information and advertisin
- Page 123 and 124:
of computer technology to the payme
- Page 125 and 126:
trend by widening the sources and u
- Page 127 and 128:
changes. That is, members can arbit
- Page 129 and 130:
ceived to be a consequence of exces
- Page 131 and 132:
lowest point in the post-World War
- Page 133 and 134:
ing. Partly in response to the drop
- Page 135 and 136:
Chart 6-3Ratio of Consumer Installm
- Page 137 and 138:
Chart 6-4RATIO1.85Real Inventory/Sa
- Page 139 and 140:
percent increase in real defense pu
- Page 141 and 142:
8.8 percent in 1981. These declines
- Page 143 and 144:
housing. Borrowing by the nonfinanc
- Page 145 and 146:
orous competitor for credit as usur
- Page 147 and 148:
1982 their share had risen to over
- Page 149 and 150:
TABLE 6-9.—Economic outlook for 1
- Page 151:
A critical element in achieving hea
- Page 155 and 156:
LETTER OF TRANSMITTALCOUNCIL OF ECO
- Page 157 and 158:
Report to the President on the Acti
- Page 159 and 160:
ety of interagency and internationa
- Page 161:
ence J. Kotlikoff (Yale University)
- Page 165 and 166:
CONTENTSNATIONAL INCOME OR EXPENDIT
- Page 167 and 168:
B-70. Mortgage debt outstanding by
- Page 169 and 170:
NATIONAL INCOME OR EXPENDITURETABLE
- Page 171 and 172:
TABLE B-2.—Gross national product
- Page 173 and 174:
19291933193919401941194219431944194
- Page 175 and 176: TABLE B-5.—Changes in GNP and GNP
- Page 177 and 178: TABLE B-7.—Gross national product
- Page 179 and 180: TABLE B-9.—Gross national product
- Page 181 and 182: TABLE B-ll.—Gross national produc
- Page 183 and 184: TABLE B-13.—Output, costs, and pr
- Page 185 and 186: TABLE B-14.—Personal consumption
- Page 187 and 188: TABLE B-16.—Gross and net private
- Page 189 and 190: TABLE B-18.—Inventories and final
- Page 191 and 192: TABLE B-20.—Relation of national
- Page 193 and 194: TABLE B-21.—National income by ty
- Page 195 and 196: TABLE B-22.—Sources of personal i
- Page 197 and 198: TABLE B-24.—Total and per capita
- Page 199 and 200: Year or quarterTotalTotalTABLE B-26
- Page 201 and 202: POPULATION, EMPLOYMENT, WAGES, AND
- Page 203 and 204: TABLE B-29.—Noninstitutional popu
- Page 205 and 206: TABLE B-31.—Selected employment a
- Page 207 and 208: TABLE B-33.—Civilian unemployment
- Page 209 and 210: TABLE B-35.—Unemployment by reaso
- Page 211 and 212: TABLE B-37.— Wage and salary work
- Page 213 and 214: TABLE B-39.—Average weekly earnin
- Page 215 and 216: TABLE B-41.—Changes in productivi
- Page 217 and 218: TABLE B-43-—Industrial production
- Page 219 and 220: TABLE B-45.—Capacity utilization
- Page 221 and 222: TABLE B-46.—New construction acti
- Page 223 and 224: TABLE B-48.—Nonfarm business expe
- Page 225: TABLE B-50.—Manufacturers' shipme
- Page 229 and 230: TABLE B-53.—Consumer price indexe
- Page 231 and 232: TABLE B-55.—Changes in consumer p
- Page 233 and 234: TABLE B-57.—Producer price indexe
- Page 235 and 236: TABLE B-58.—Producer price indexe
- Page 237 and 238: TABLE B-59.—Producer price indexe
- Page 239 and 240: MONEY STOCK, CREDIT, AND FINANCETAB
- Page 241 and 242: TABLE B-63.—Commercial bank loans
- Page 243 and 244: TABLE B-64.—Total funds raised in
- Page 245 and 246: TABLE B-66.—Aggregate reserves of
- Page 247 and 248: TABLE B-67 .—Bond yields and inte
- Page 249 and 250: TABLE B-69.—Consumer installment
- Page 251 and 252: TABLE B-71-—Mortgage debt outstan
- Page 253 and 254: TABLE B-72.—Federal budget receip
- Page 255 and 256: TABLE B-74.—Relation of Federal G
- Page 257 and 258: TABLE B-76.—Federal Government re
- Page 259 and 260: TABLE B-78.—State and local gover
- Page 261 and 262: TABLE B-80.—Estimated ownership o
- Page 263 and 264: CORPORATE PROFITS AND FINANCETABLE
- Page 265 and 266: Year or quarterTABLE B-84.—Corpor
- Page 267 and 268: TABLE B-86.—Relation of profits a
- Page 269 and 270: TABLE B-88.—Determinants of busin
- Page 271 and 272: TABLE B-9Q.~Current assets and liab
- Page 273 and 274: TABLE B-92.—Common stock prices a
- Page 275 and 276: AGRICULTURETABLE B-94.—Farm incom
- Page 277 and 278:
TABLE B-96.—Farm input use, selec
- Page 279 and 280:
TABLE B-98.—U.S. exports and impo
- Page 281 and 282:
INTERNATIONAL STATISTICSTABLE B-100
- Page 283 and 284:
TABLE B-101.—U.S. international t
- Page 285 and 286:
TABLE B-103.—U.S. merchandise exp
- Page 287 and 288:
TABLE B-105.—International invest
- Page 289 and 290:
TABLE B-107.— World trade balance
- Page 291 and 292:
TABLE B-109.—Growth rates in real
- Page 293:
TABLE B-lll.—Unemployment rate, a