TABLE B-101.—£7.5. international transactions, 1946-82[Millions <strong>of</strong> dollars; quarterly data seasonally adjusted, except as noted. Credits ( + )• debits ( }]Year orquarterMerchandise 12Exports Imports NetInvestment income 3Receipts Payments NetNetmilitarytransactionsNettravelandtransportationreceiptsO<strong>the</strong>rservices,net aBalanceon goodsandservices * ARemittances,pensions,and o<strong>the</strong>runilateraltransfers'Balanceoncurrentaccountl *1946..1947..1948..1949..1950..1951..1952..1953..1954..1955..1956..1957..1958..1959..I960..1961..1962..1963..1964..1965..1966..1967..1968..1969..1970..1971..1972..1973..1974..1975,.1976..1977..1978..1979..11,76416,09713,26512,21310,20314,24313,44912,41212,92914,42417,55619,56216,41416,45819,65020,10820,78122,27225,50126,46129,31030,66633,62636,41442,46943,31949,38171,41098,306107,088114,745120,816142,054184,473^5,067^5,973-7,557-6,874-9,081-11,176-10,838-10,975-10,353-11,527= 12,803-13,291= 12,952-15,310= 14,758= 14,537= 16,260-17,048-18,700=21,510=25,493-26,866-32,991-35,807- 39,866=45,579-55,797-70,499-103,649-98,041=-124,051= 151,689475,813-211.8196,69710,1245,7085,3391,1223,0672,61114372,5762,8974,7536,2713,4621,1484,8925,5714,5215,2246,8014,9513,8173,8006356072,603-2,260-6,416911-5,3439,047-9,306-30,873-33,759-27,3467721,1021,9211,8312,0682,6332,7512,7362,9293,4063,8374,1803,7904,1324,6164,9995,6186,1576,8247,4377,5288,0209,36810,91211,74712,70714,76421,80827,58725,35129,28632,17942,24564,129-212-245-437=476-559-583-555-624-582-676-735-796-825-1,061-1,237-1,245-1,324-1,561-1,784-2,088-2,481-2,747-3,378-4,869-5,516-5,436-6,572-9,655-12,084-12,564-13,311-14,217-21,680-32,9145608571,4841,3551,5092,0502,1962,1122,3472,7303,1023,3842,9653,0713,3793,7544,2944,5965,0405,3495,0475,2735,9906,0436,2317,2718,19212,15315,50312,78715,97517,96220,56531,215-493-455^799-621-576-1,270-2,054-2,423-2,460-2,701-2,788-2,841-3,135=-2,805-2,752-2,596-2,449-2,304-2,133-2,122-2,935-3,226-3,143=3,328-3,354-2,893-3,420-2,070-1,653-7465591,528621-2,035733946374230-12029883-238-269-297-361-189-633-821-964-978-1,152-1,309-1,146-1,280-1,331-1,750-1,548-1,763-2,038-2,345-3,063-3,158-3,184-2,792-2,558-3,293-3,125-2,4293101451752082422543093073052994474824865735795948099601,0411,3871,3651,6121,6301,8332,1802,4952,7663,1843,9864,5984,7115,2245,9555,6907,80711,6176,9426,5112,1774,3993,1451,1952,4992,9285,1537,1073,1451,1665,1326,3466,0257,1679,6048,2855,9635,7083,5633,3935,6252,269= 1,94111,0219,30922,8939,382-9,451-9,7435,095=2,922=2,625-4,525= 5,638=4,017= 3,515-2,531-2,481-2,280-2,498-2,423-2,345=2,361=2,448-2,308-2,524-2,638=2,754-2,781-2,854-2,932-3,125-2,952-2,994-3,294-3,701-3,854-3,8818 -7,186=4,613-4,998-4,617-5,030-5,5614,8858,9922,417873-1,840884614= 1,2862194302,7304,762784-1,2822,8243,8223,3874,4146,8235,4323,0312,5836113992,331-1,433-5,7957,1402,12418,2804,384-14,068-14,7734661980....1981....1980:IIV1981:IIV1982:II111*..224,237236,25454,75255,84355,78657,85660,68360,28457,69457,59355,78055,17452,480-249,575264,143-64,431-62,363-59,735=63,046-64,995-66,831-65,539-66,778-61,653- 60,869=64,938-25,338-27,889-9,679-6,520-3,949-5,190-4,312-6,547=7,845-9,185-5,873-5,695-12,45872,68685,94519,94416,01617,84818,87720,52821,64222,04821,72720,89022,56221,880-42,776-52,908= 10,505-10,268-10,485-11,519-12,405-13,441-13,865-13,198-14,029-14,874-14,46229,91033,0379,4395,7487,3637,3588,1238,2018,1838,5296,8617,6887,418-2,471-1,541•=931-514-286-742=-48758761-528167247527-940-231-436= 216-114-174-495-139200203-66-=319-2017,1447,7021,6441,8081,8101,8791.8381,9811,9601,9242,0342,0502.1408,30311,079373064,8243,1314,6672,9092,5599433,1233,9712,574=6,783-6,608= 1,837-1,306-1,444-2,195-1,422-1,510-1,808= 1,870-2,048-1,740-1,6531,5204,471-1,800-1,0003,3809363,2451,399751-9271,0752,231-4,2271 Excludes military.8 Adjusted from Census data for differences in valuation, coverage, and timing.o Fees and royalties from U.S. direct investments abroad or from foreign direct investments in <strong>the</strong> United States are excluded frominvestment income and included in o<strong>the</strong>r services, net.4 In concept balance on goods and services is equal to net exports and imports in <strong>the</strong> national income and product accounts (and<strong>the</strong> sum <strong>of</strong> balance on current account and allocations <strong>of</strong> special drawing rights is equal to net foreign investment in <strong>the</strong> accounts),although <strong>the</strong> series differ because <strong>of</strong> different handling <strong>of</strong> certain items (gold, extraordinary military shipments, etc.), revisions, etc.6 Includes extraordinary U.S. Government transactions with India.See next page for continuation <strong>of</strong> table.276
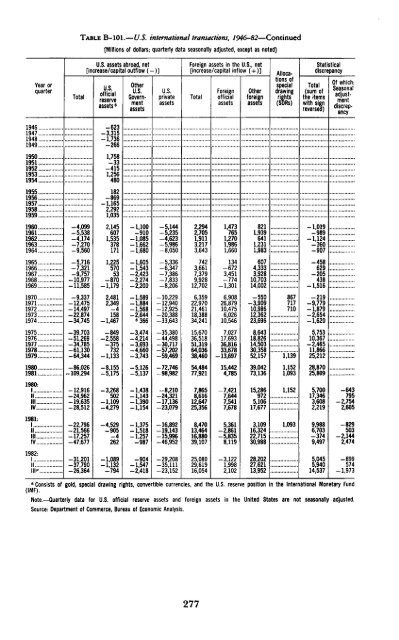
TABLE B-101.—U.S. international transactions, 1946-82—Continued[Millions <strong>of</strong> dollars; quarterly data seasonally adjusted, except as noted]Year orquarterTotalU.S. assets abroad, net[increase/capital outflow 43-5,126-5,137-1,438-1,143-1,390-1,1545,144-5,2354,623-5,9868,0505,336-6,347-7,386-7,833-8,20610,22912,940-12,92520,388-33,643-35,38044,498-30,717-57,20259,469-72,74698,982-8,21024,32117,136-23,0792,2942,7051,9113,2173,6437423,6617,3799,92812,7026,35922,97021,46118,38834,24115,67036,51851,31964,03638,46054,48477,9217,8658,61612,64725,3561,4737651,2701,9861,660134-6723,451-774-1,3016,90826,87910,4756,02610,5467,02717,69336,81633,678-13,69715,4424,7857,4217,6447,5417,6788211,9396411,2311,9836074,3333,92810,70314,002-550-3,90910,98612,36223,6968,64318,82614,50330,35852,15739,04273,13615,2869725,10617,6778677177101,1*39"1,1521,0931,152-1019-989-1,124-360-907-458629-205438-1,516-219-9,779-1,879-2,654-1,6205,75310,367-2,46511,86625,21228,87025,8095,70017,3463,6082,219-643795-2,7542,6051981:1IIIllIV1982:1II|||p-22,796-21,566-17,257-47,677-31,201-37,790-26,364-4,529-905262-1,089-1,132-794-1,375-1,518-1,257-987-904-1,547-2,41816,892-19,143-15,996-46,952-29,20835,111-23,1528,47013,46416,88039,10725,08029,61916,0545,361-2,861-5,8358,119-3,1221,9982,1023,10916,32422,71530,98828,20227,62113,9521.0939,9886,703-3749,4975,0455,94014,537-=829503-2,1442,474-899574-1,973e Consists <strong>of</strong> gold, special drawing rights, convertible currencies, and <strong>the</strong> U.S. reserve position in <strong>the</strong> International Monetary Fund(ItVlrJ.Note.—Quarterly data for U.S. <strong>of</strong>ficial reserve assets and foreign assets in <strong>the</strong> United States are not seasonally adjusted.Source: Department <strong>of</strong> Commerce, Bureau <strong>of</strong> <strong>Economic</strong> Analysis.277
- Page 5:
CONTENTSPageECONOMIC REPORT OF THE
- Page 9 and 10:
ECONOMIC REPORT OF THE PRESIDENTTo
- Page 11 and 12:
Monetary policy will play a critica
- Page 13 and 14:
Interest Rates and the U.S. Trade D
- Page 15:
THE ANNUAL REPORTOF THECOUNCIL OF E
- Page 19 and 20:
CONTENTSPageCHAPTER 1. FROM RECESSI
- Page 21 and 22:
PageConclusions 122CHAPTER 6. REVIE
- Page 23 and 24:
CHAPTER 1From Recession to Recovery
- Page 25 and 26:
slowed somewhat in the 1970s regard
- Page 27 and 28:
nal GNP growth is reflected in a sl
- Page 29 and 30:
inflation. More specifically, the A
- Page 31 and 32:
inflation rate, or with a 12 percen
- Page 33 and 34:
1988, an increase of about one-four
- Page 35 and 36:
CHAPTER 2The Dual Problems of Struc
- Page 37 and 38:
frequently associated with poor hea
- Page 39 and 40:
Chart 2-2Distribution of Unemployme
- Page 41 and 42:
Chart 2-4Distribution of Unemployme
- Page 43 and 44:
These findings suggest several conc
- Page 45 and 46:
Wage RigidityA number of studies sh
- Page 47 and 48:
that these measures may have caused
- Page 49 and 50:
Most young people find jobs or leav
- Page 51 and 52:
to employers who hire youths. Tax c
- Page 53 and 54:
defined broadly to include individu
- Page 55 and 56:
ship between incomplete experience
- Page 57 and 58:
CHAPTER 3The United States in the W
- Page 59 and 60:
with 2.6 percent in the other Organ
- Page 61 and 62:
TABLE 3-1 .—Structure ofthe U.S.
- Page 63 and 64:
TABLE 3-2.—Trade balances by comm
- Page 65 and 66:
concentrate on doing what it does r
- Page 67 and 68:
the United States will depress pric
- Page 69 and 70:
Chart 3-3Real Exchange Rates Of Maj
- Page 71 and 72:
AN UNDERVALUED YEN?The explanations
- Page 73 and 74:
arily reduced the international com
- Page 75 and 76:
nancial markets. These transactions
- Page 77 and 78:
TABLE 3-6.—Economic performance b
- Page 79 and 80:
were undoubtedly a highly favorable
- Page 81 and 82:
of lenders that some debtors will n
- Page 83 and 84:
CHAPTER 4Increasing Capital Formati
- Page 85 and 86:
ate of net investment was required,
- Page 87 and 88:
able share in Japan and 56 percent
- Page 89 and 90:
During the 1970s, productivity grow
- Page 91 and 92:
MEASURING NATIONAL SAVINGDomestic s
- Page 93 and 94:
TAX RULES AND PERSONAL SAVINGMany e
- Page 95 and 96:
on consumption taxation might also
- Page 97 and 98:
Nevertheless, a number of economic
- Page 99 and 100:
tion permitted businesses to deprec
- Page 101 and 102:
A final problem under current tax l
- Page 103 and 104:
fleeted efforts to deal with proble
- Page 105 and 106:
egulation was probably not applicab
- Page 107 and 108:
Aeronautics Board, for example, the
- Page 109 and 110:
system resulted. Price controls, wh
- Page 111 and 112:
NGPA, both controlled and decontrol
- Page 113 and 114:
Price and allocation controls only
- Page 115 and 116:
nications industries through the re
- Page 117 and 118:
Several major pieces of legislation
- Page 119 and 120:
tempt to set cartel rates would be
- Page 121 and 122:
computer information and advertisin
- Page 123 and 124:
of computer technology to the payme
- Page 125 and 126:
trend by widening the sources and u
- Page 127 and 128:
changes. That is, members can arbit
- Page 129 and 130:
ceived to be a consequence of exces
- Page 131 and 132:
lowest point in the post-World War
- Page 133 and 134:
ing. Partly in response to the drop
- Page 135 and 136:
Chart 6-3Ratio of Consumer Installm
- Page 137 and 138:
Chart 6-4RATIO1.85Real Inventory/Sa
- Page 139 and 140:
percent increase in real defense pu
- Page 141 and 142:
8.8 percent in 1981. These declines
- Page 143 and 144:
housing. Borrowing by the nonfinanc
- Page 145 and 146:
orous competitor for credit as usur
- Page 147 and 148:
1982 their share had risen to over
- Page 149 and 150:
TABLE 6-9.—Economic outlook for 1
- Page 151:
A critical element in achieving hea
- Page 155 and 156:
LETTER OF TRANSMITTALCOUNCIL OF ECO
- Page 157 and 158:
Report to the President on the Acti
- Page 159 and 160:
ety of interagency and internationa
- Page 161:
ence J. Kotlikoff (Yale University)
- Page 165 and 166:
CONTENTSNATIONAL INCOME OR EXPENDIT
- Page 167 and 168:
B-70. Mortgage debt outstanding by
- Page 169 and 170:
NATIONAL INCOME OR EXPENDITURETABLE
- Page 171 and 172:
TABLE B-2.—Gross national product
- Page 173 and 174:
19291933193919401941194219431944194
- Page 175 and 176:
TABLE B-5.—Changes in GNP and GNP
- Page 177 and 178:
TABLE B-7.—Gross national product
- Page 179 and 180:
TABLE B-9.—Gross national product
- Page 181 and 182:
TABLE B-ll.—Gross national produc
- Page 183 and 184:
TABLE B-13.—Output, costs, and pr
- Page 185 and 186:
TABLE B-14.—Personal consumption
- Page 187 and 188:
TABLE B-16.—Gross and net private
- Page 189 and 190:
TABLE B-18.—Inventories and final
- Page 191 and 192:
TABLE B-20.—Relation of national
- Page 193 and 194:
TABLE B-21.—National income by ty
- Page 195 and 196:
TABLE B-22.—Sources of personal i
- Page 197 and 198:
TABLE B-24.—Total and per capita
- Page 199 and 200:
Year or quarterTotalTotalTABLE B-26
- Page 201 and 202:
POPULATION, EMPLOYMENT, WAGES, AND
- Page 203 and 204:
TABLE B-29.—Noninstitutional popu
- Page 205 and 206:
TABLE B-31.—Selected employment a
- Page 207 and 208:
TABLE B-33.—Civilian unemployment
- Page 209 and 210:
TABLE B-35.—Unemployment by reaso
- Page 211 and 212:
TABLE B-37.— Wage and salary work
- Page 213 and 214:
TABLE B-39.—Average weekly earnin
- Page 215 and 216:
TABLE B-41.—Changes in productivi
- Page 217 and 218:
TABLE B-43-—Industrial production
- Page 219 and 220:
TABLE B-45.—Capacity utilization
- Page 221 and 222:
TABLE B-46.—New construction acti
- Page 223 and 224:
TABLE B-48.—Nonfarm business expe
- Page 225 and 226:
TABLE B-50.—Manufacturers' shipme
- Page 227 and 228:
Year or monthAllitemsPRICESTABLE B-
- Page 229 and 230:
TABLE B-53.—Consumer price indexe
- Page 231 and 232: TABLE B-55.—Changes in consumer p
- Page 233 and 234: TABLE B-57.—Producer price indexe
- Page 235 and 236: TABLE B-58.—Producer price indexe
- Page 237 and 238: TABLE B-59.—Producer price indexe
- Page 239 and 240: MONEY STOCK, CREDIT, AND FINANCETAB
- Page 241 and 242: TABLE B-63.—Commercial bank loans
- Page 243 and 244: TABLE B-64.—Total funds raised in
- Page 245 and 246: TABLE B-66.—Aggregate reserves of
- Page 247 and 248: TABLE B-67 .—Bond yields and inte
- Page 249 and 250: TABLE B-69.—Consumer installment
- Page 251 and 252: TABLE B-71-—Mortgage debt outstan
- Page 253 and 254: TABLE B-72.—Federal budget receip
- Page 255 and 256: TABLE B-74.—Relation of Federal G
- Page 257 and 258: TABLE B-76.—Federal Government re
- Page 259 and 260: TABLE B-78.—State and local gover
- Page 261 and 262: TABLE B-80.—Estimated ownership o
- Page 263 and 264: CORPORATE PROFITS AND FINANCETABLE
- Page 265 and 266: Year or quarterTABLE B-84.—Corpor
- Page 267 and 268: TABLE B-86.—Relation of profits a
- Page 269 and 270: TABLE B-88.—Determinants of busin
- Page 271 and 272: TABLE B-9Q.~Current assets and liab
- Page 273 and 274: TABLE B-92.—Common stock prices a
- Page 275 and 276: AGRICULTURETABLE B-94.—Farm incom
- Page 277 and 278: TABLE B-96.—Farm input use, selec
- Page 279 and 280: TABLE B-98.—U.S. exports and impo
- Page 281: INTERNATIONAL STATISTICSTABLE B-100
- Page 285 and 286: TABLE B-103.—U.S. merchandise exp
- Page 287 and 288: TABLE B-105.—International invest
- Page 289 and 290: TABLE B-107.— World trade balance
- Page 291 and 292: TABLE B-109.—Growth rates in real
- Page 293: TABLE B-lll.—Unemployment rate, a