TABLE B-23.—Disposition <strong>of</strong> personal income, 1929-82[Billions <strong>of</strong> dollars, except as noted; quarterly data at seasonally adjusted annual rates]Year or quarter192919331939194019411942194319441945 ,.,1946194719481949195019511952 ....'.'.....'.* .*1953 . ..195419551956195719581959I9601961196219631964196519661967196819691970197119721973197419751976197719781979198019811982 p1980:IItHIIV1981:|||HIIV1982:1||III\M PPersonalincome85.047.072.477.9954122.6150 8164.5170.0177 6190.1209 0206.4227.2254.9271.8287 7289.6310 3332.6351.0361.1384.4402.3417 8443.6466 2499.2540.7588.2630.0690.6754.7811.1868.4951.41,065.21,168.61,265.01,391.21,540.41,732.71,951.22,160.42,415.82,569.72,086.82,109.62,185.32,260.02,330.02,380.62,458.22,494.62,510.52,552.72,592.52,623.2Less:Personaltax andnontaxpayments2614242.6335.917 818.920 818 721421018.520.628.934.035 532.535439.742 442.146.050 452156860 358.664.974.582197.2115.7115.8116 7141.0150.7170.2168.9196.82264258.7301.0336.3386.7397.2319.9328 6339.7357.1371.2384.23981393.2393.4401.2394.4399.7Equals:Disposablepersonalincome82.445.670.075.392 2116.6133 0145.61491158 9168.7188 0187.9206.6226.0237.7252 2257.1275 0292.9308 6319.0338.4352 0365838684059440.6475.8513.7547 9593.4638.9695.37518810.3914.5998.31,096.11,194.41,314 01,474.01,650.21,824.12,029.12,172.51,766.91,78101,845.51,902.91,958.71,996.52,060 02,101.42,117.12,151.52,198.12,223.5Total79.146.567.872.081.889.4100.1109.0120.4145 2163.51769180.4194.7210.0220.4233 7240.1258 5271.6286 4295.4317.3332.3342 7363.5384 0411.0442.1477.7503 6551.5598.3639.56911757.7835.5913.21,001.81,111.91,236 01,384.61,553.51,717.91,898.92,031.41,669.11,672 41,732.51,797.61,852.81,874.51,925.71,942.71,977.92,007.22,046.12,094.6Source: Department <strong>of</strong> Commerce, Bureau <strong>of</strong> <strong>Economic</strong> Analysis.Less: Personal outlaysPersonalconsumptionexpenditures77.345.867.071.080.888.699.4108.2119.5143.8161.7174.7178.1192.0207.1217.1229.7235.8253.7266.0280.4289.5310.8324.93350355.2374 6400.5430.4465.1490.3536.9581.8621.7672 2737.1812.0888.1976.41,084.31 204.41,346.51,507.21,667.21,843.21,972.01,618.71622 21,682.21,745.81,799.91,819.41,868.81,884.51,919.41,947.81,986.32,034.61.5.5.7.8.9ij.71.01.41.72.32.52.93.63.84.45.15.55.66.17.0737.8889.9U.I12.012.513.815.616.717.719.522.324.124.426.730.737.445.549.955.158.649.649.449.750.852.454.456.257.557.858.459.059.1Interestpaid byconsumerstobusinessPersonaltransferpaymentst<strong>of</strong>oreigners(net)Equals:Personalsaving0.3 3.3.2 -0.9.2 2.2.2 3.410.3.1 27.2.2 32.9.4 36.6.5 28.7.7 13 7J 5.2,7 11.1.5 7.5.4 11.9.4 16.1.4 17.4.5 18.5.5 17.0,4 16.4.5 21.3.5 22.3.4 23.6.4 21.1.4 19.7.4 23 0.5 23.3.6 219.6 29.6.7 33.7.7 36.0.9 44.3.8 41.9.9 40.61.1 55.81.1 60.71.1 52.61.3 79.01.0 85.1.9 94.3.9 82.5.9 78 0.8 89.4.8 96.7.8 106.2.6 130.2.9 141.1.7 97 9.7 108 6.8 113.1.9 105.3,5 105 9.8 122.0134 4.7 158.6.8 139.1.9 144.3.8 152.0.9 128.9Percent <strong>of</strong> disposablepersonal incorPersonal outlaysTotal96.0102.096.995.588.876.775.374.880.891.496.994.196.094.292.992.792.793.494.092.792.892.693.894.493.794.094.693.392.993.091.992.993.692.091.993.591.491.591.493.194.193.994194.293.693.594 593993.994.594.693.993 592.593.493.393.194.2PersonalConsumptionexpenditures93.8100.595.694.287.676.074.774.380.190.595.993.094.892.991.691.391.191.792.390.890.990.791.892.391.691.892.390.990.590.589.590.591.189.489.491.088.889.089.190.891.791.391.391.490.890.891691191.191.791991.190 789.790.790.590.491.5Personalsaving4.0=2.03.14.511.223.324.725.219.28.63.15.94.05.87.17.37.36.66.07.37.27.46.25.66.36.05.46.77.17.08.17.16.48.08.16.58.68.58.66.95.96.15.95.86.46.55.5616.15.5546.1657.56.66.76.95.8190
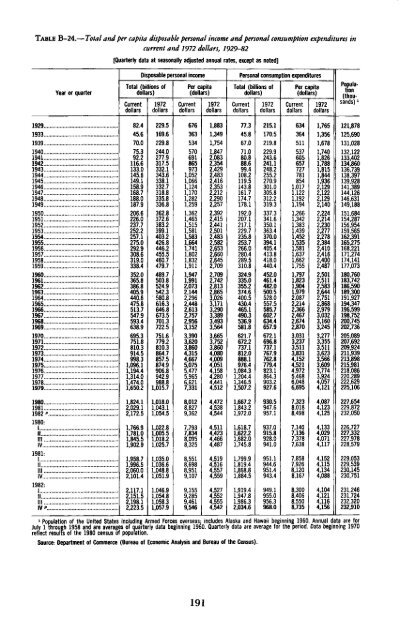
TABLE B-24.—Total and per capita disposable personal income and personal consumption expenditures incurrent and 1972 dollars, 1929-82[Quarterly data at seasonally adjusted annual rates, except as noted]Disposable personal incomePersonal consumption expendituresYear or quarterTotal (billions <strong>of</strong>dollars)Currentdollars1972dollarsCurrentdollarsPer capita(dollars)1972dollarsTotal (billions <strong>of</strong>dollars)Currentdollars1972dollarsCurrentdollarsPer capita(dollars)1972dollarsPopulation(thousands)l1929...,1933...,1939....1940....1941...,1942....1943...1944....1945....1946....1947....1948....1949...,1950...,1951...,1952...,1953....1954...,1955...,1956...,1957...,1958....1959...,I960...,1961...,1962...,1963....1964....1965...,1966....1967...,1968...1969....1970...1971...1972...1973...1974...1975...,1976...1977...1978...1979...82.445.670.075.392.2116.6133.0145.6149.1158.9168.7188.0187.9206.6226.0237.7252.2257.1275.0292.9308.6319.0338.4352.0365.8386.8405.9440.6475.8513.7547.9593.4638.9695.3751.8810.3914.5998.31,096.11,194.41,314.01,474.01,650.2229.5169.6229.8244.0277.9317.5332.1343.6338.1332.7318.8335.8336.8362.8372.6383.2399.1403.2426.8446.2455.5460.7479.7489.7503.8524.9542.3580.8616.3646.8673.5701.3722.5751.6779.2810.3864.7857.5874.9906.8942.9988.81,015.76763635345706918659731,0521,0661,1241,1701,2821,2591,3621,4651,5151,5811,5831,6641,7411,8021,8321,9111,9471,9912,0732,1442,2962,4482,6132,7572,9563,1523,3903,6203,8604,3154,6675,0755,4775,9656,6217,3311,8831,3491,7541,8472,0832,3542,4292,4832,4162,3532,2122,2902,2572,3922,4152,4412,5012,4832,5822,6532,6602,6452,7092,7092,7422,8132,8653,0263,1713,2903,3893,4933,5643,6653,7523,8604,0804,0094,0514,1584,2804,4414,51277.345.867.071.080.888.699.4108.2119.5143.8161.7174.7178.1192.0207.1217.1229.7235.8253.7266.0280.4289.5310.8324.9335.0355.2374.6400.5430.4465.1490.3536.9581.8621.7672.2737.1812.0888.1976.41,084.31,204.41,346.51,507.2215.1170.5219.8229.9243.6241.1248.2255.2270.9301.0305.8312.2319.3337.3341.6350.1363.4370.0394.1405.4413.8418.0440.4452.0461.4482.0500.5528.0557.5585.7602.7634.4657.9672.1696.8737.1767.9762.8779.4823.1864.3903.2927.66343645115376056577277818541,0171,1221,1921,1941,2661,3421,3831,4391,4521,5351,5811,6371,6621,7551,7971,8231,9041,9792,0872,2142,3662,4672,6742,8703,0313,2373,5113,8314,1524,5214,9725,4686,0486,6951,7651,3561,6781,7401,8261,7881,8151,8441,9362,1292,1222,1292,1402,2242,2142,2302,2772,2782,3842,4102,4162,4002,4872,5012,5112,5832,6442,7512,8682,9793,0323,1603,2453,2773,3553,5113,6233,5663,6093,7743,9244,0574,121121,878125,690131,028132,122133,402134,860136,739138,397139,928141,389144,126146,631149,188151,684154,287156,954159,565162,391165,275168,221171,274174,141177,073180,760183,742186,590189,300191,927194,347196,599198,752200,745202,736205,089207,692209,924211,939213,898215,981218,086220,289222,629225,1061980...,1981...,1982 ",1,824.12,029.12,172.51,018.01,043.11,054.58,0128,8279,3624,4724,5384,5441,667.21,843.21,972.0930.5947.6957.17,3238,0188,4984,0874,1234,125227,654229,872232,0501980:IIIIII ....IV1981:IIIIll...,IV1982:Ii!Z1,766.91,781.01,845.51,902.91,958.71,996.52,060.02,101.42,117.12,151.52,198.12,223.51,022.81,005.51,018.21,025.71,035.01,036.61,048.81,051.91,046.91,054.81,058.31,057.97,7937,8348,0958,3258,5518,6988,9519,1079,1559,2859,4619,5464,5114,4234,4664,4874,5194,5164,5574,5594,5274,5524,5554,5421,618.71,622.21,682.01,745.81,799.91,819.41,868.81,884.51,919.41,947.81,986.32,034.6937.0915.8928.0941.0951.1944.6951.4943.4949.1955.0956.3968.07,1407,1367,3787,6387,8587,9268,1208,1678,3008,4068,5508,7354,1334,0294,0714,1174,1524,1154,1344,0884,1044,1214,1164,156226,727227,332227,978228,579229,053229,539230,145230,751231,246231,724232,320232,9101 Population <strong>of</strong> <strong>the</strong> United States including Armed Forces overseas; includes Alaska and Hawaii beginning 1960. Annual data are forJuly 1 through 1958 and are averages <strong>of</strong> quarterly data beginning 1960. Quarterly data are average for <strong>the</strong> period. Data beginning 1970reflect results <strong>of</strong> <strong>the</strong> 1980 census <strong>of</strong> population.Source: Department <strong>of</strong> Commerce (Bureau <strong>of</strong> <strong>Economic</strong> Analysis and Bureau <strong>of</strong> <strong>the</strong> Census).191
- Page 5:
CONTENTSPageECONOMIC REPORT OF THE
- Page 9 and 10:
ECONOMIC REPORT OF THE PRESIDENTTo
- Page 11 and 12:
Monetary policy will play a critica
- Page 13 and 14:
Interest Rates and the U.S. Trade D
- Page 15:
THE ANNUAL REPORTOF THECOUNCIL OF E
- Page 19 and 20:
CONTENTSPageCHAPTER 1. FROM RECESSI
- Page 21 and 22:
PageConclusions 122CHAPTER 6. REVIE
- Page 23 and 24:
CHAPTER 1From Recession to Recovery
- Page 25 and 26:
slowed somewhat in the 1970s regard
- Page 27 and 28:
nal GNP growth is reflected in a sl
- Page 29 and 30:
inflation. More specifically, the A
- Page 31 and 32:
inflation rate, or with a 12 percen
- Page 33 and 34:
1988, an increase of about one-four
- Page 35 and 36:
CHAPTER 2The Dual Problems of Struc
- Page 37 and 38:
frequently associated with poor hea
- Page 39 and 40:
Chart 2-2Distribution of Unemployme
- Page 41 and 42:
Chart 2-4Distribution of Unemployme
- Page 43 and 44:
These findings suggest several conc
- Page 45 and 46:
Wage RigidityA number of studies sh
- Page 47 and 48:
that these measures may have caused
- Page 49 and 50:
Most young people find jobs or leav
- Page 51 and 52:
to employers who hire youths. Tax c
- Page 53 and 54:
defined broadly to include individu
- Page 55 and 56:
ship between incomplete experience
- Page 57 and 58:
CHAPTER 3The United States in the W
- Page 59 and 60:
with 2.6 percent in the other Organ
- Page 61 and 62:
TABLE 3-1 .—Structure ofthe U.S.
- Page 63 and 64:
TABLE 3-2.—Trade balances by comm
- Page 65 and 66:
concentrate on doing what it does r
- Page 67 and 68:
the United States will depress pric
- Page 69 and 70:
Chart 3-3Real Exchange Rates Of Maj
- Page 71 and 72:
AN UNDERVALUED YEN?The explanations
- Page 73 and 74:
arily reduced the international com
- Page 75 and 76:
nancial markets. These transactions
- Page 77 and 78:
TABLE 3-6.—Economic performance b
- Page 79 and 80:
were undoubtedly a highly favorable
- Page 81 and 82:
of lenders that some debtors will n
- Page 83 and 84:
CHAPTER 4Increasing Capital Formati
- Page 85 and 86:
ate of net investment was required,
- Page 87 and 88:
able share in Japan and 56 percent
- Page 89 and 90:
During the 1970s, productivity grow
- Page 91 and 92:
MEASURING NATIONAL SAVINGDomestic s
- Page 93 and 94:
TAX RULES AND PERSONAL SAVINGMany e
- Page 95 and 96:
on consumption taxation might also
- Page 97 and 98:
Nevertheless, a number of economic
- Page 99 and 100:
tion permitted businesses to deprec
- Page 101 and 102:
A final problem under current tax l
- Page 103 and 104:
fleeted efforts to deal with proble
- Page 105 and 106:
egulation was probably not applicab
- Page 107 and 108:
Aeronautics Board, for example, the
- Page 109 and 110:
system resulted. Price controls, wh
- Page 111 and 112:
NGPA, both controlled and decontrol
- Page 113 and 114:
Price and allocation controls only
- Page 115 and 116:
nications industries through the re
- Page 117 and 118:
Several major pieces of legislation
- Page 119 and 120:
tempt to set cartel rates would be
- Page 121 and 122:
computer information and advertisin
- Page 123 and 124:
of computer technology to the payme
- Page 125 and 126:
trend by widening the sources and u
- Page 127 and 128:
changes. That is, members can arbit
- Page 129 and 130:
ceived to be a consequence of exces
- Page 131 and 132:
lowest point in the post-World War
- Page 133 and 134:
ing. Partly in response to the drop
- Page 135 and 136:
Chart 6-3Ratio of Consumer Installm
- Page 137 and 138:
Chart 6-4RATIO1.85Real Inventory/Sa
- Page 139 and 140:
percent increase in real defense pu
- Page 141 and 142:
8.8 percent in 1981. These declines
- Page 143 and 144:
housing. Borrowing by the nonfinanc
- Page 145 and 146: orous competitor for credit as usur
- Page 147 and 148: 1982 their share had risen to over
- Page 149 and 150: TABLE 6-9.—Economic outlook for 1
- Page 151: A critical element in achieving hea
- Page 155 and 156: LETTER OF TRANSMITTALCOUNCIL OF ECO
- Page 157 and 158: Report to the President on the Acti
- Page 159 and 160: ety of interagency and internationa
- Page 161: ence J. Kotlikoff (Yale University)
- Page 165 and 166: CONTENTSNATIONAL INCOME OR EXPENDIT
- Page 167 and 168: B-70. Mortgage debt outstanding by
- Page 169 and 170: NATIONAL INCOME OR EXPENDITURETABLE
- Page 171 and 172: TABLE B-2.—Gross national product
- Page 173 and 174: 19291933193919401941194219431944194
- Page 175 and 176: TABLE B-5.—Changes in GNP and GNP
- Page 177 and 178: TABLE B-7.—Gross national product
- Page 179 and 180: TABLE B-9.—Gross national product
- Page 181 and 182: TABLE B-ll.—Gross national produc
- Page 183 and 184: TABLE B-13.—Output, costs, and pr
- Page 185 and 186: TABLE B-14.—Personal consumption
- Page 187 and 188: TABLE B-16.—Gross and net private
- Page 189 and 190: TABLE B-18.—Inventories and final
- Page 191 and 192: TABLE B-20.—Relation of national
- Page 193 and 194: TABLE B-21.—National income by ty
- Page 195: TABLE B-22.—Sources of personal i
- Page 199 and 200: Year or quarterTotalTotalTABLE B-26
- Page 201 and 202: POPULATION, EMPLOYMENT, WAGES, AND
- Page 203 and 204: TABLE B-29.—Noninstitutional popu
- Page 205 and 206: TABLE B-31.—Selected employment a
- Page 207 and 208: TABLE B-33.—Civilian unemployment
- Page 209 and 210: TABLE B-35.—Unemployment by reaso
- Page 211 and 212: TABLE B-37.— Wage and salary work
- Page 213 and 214: TABLE B-39.—Average weekly earnin
- Page 215 and 216: TABLE B-41.—Changes in productivi
- Page 217 and 218: TABLE B-43-—Industrial production
- Page 219 and 220: TABLE B-45.—Capacity utilization
- Page 221 and 222: TABLE B-46.—New construction acti
- Page 223 and 224: TABLE B-48.—Nonfarm business expe
- Page 225 and 226: TABLE B-50.—Manufacturers' shipme
- Page 227 and 228: Year or monthAllitemsPRICESTABLE B-
- Page 229 and 230: TABLE B-53.—Consumer price indexe
- Page 231 and 232: TABLE B-55.—Changes in consumer p
- Page 233 and 234: TABLE B-57.—Producer price indexe
- Page 235 and 236: TABLE B-58.—Producer price indexe
- Page 237 and 238: TABLE B-59.—Producer price indexe
- Page 239 and 240: MONEY STOCK, CREDIT, AND FINANCETAB
- Page 241 and 242: TABLE B-63.—Commercial bank loans
- Page 243 and 244: TABLE B-64.—Total funds raised in
- Page 245 and 246: TABLE B-66.—Aggregate reserves of
- Page 247 and 248:
TABLE B-67 .—Bond yields and inte
- Page 249 and 250:
TABLE B-69.—Consumer installment
- Page 251 and 252:
TABLE B-71-—Mortgage debt outstan
- Page 253 and 254:
TABLE B-72.—Federal budget receip
- Page 255 and 256:
TABLE B-74.—Relation of Federal G
- Page 257 and 258:
TABLE B-76.—Federal Government re
- Page 259 and 260:
TABLE B-78.—State and local gover
- Page 261 and 262:
TABLE B-80.—Estimated ownership o
- Page 263 and 264:
CORPORATE PROFITS AND FINANCETABLE
- Page 265 and 266:
Year or quarterTABLE B-84.—Corpor
- Page 267 and 268:
TABLE B-86.—Relation of profits a
- Page 269 and 270:
TABLE B-88.—Determinants of busin
- Page 271 and 272:
TABLE B-9Q.~Current assets and liab
- Page 273 and 274:
TABLE B-92.—Common stock prices a
- Page 275 and 276:
AGRICULTURETABLE B-94.—Farm incom
- Page 277 and 278:
TABLE B-96.—Farm input use, selec
- Page 279 and 280:
TABLE B-98.—U.S. exports and impo
- Page 281 and 282:
INTERNATIONAL STATISTICSTABLE B-100
- Page 283 and 284:
TABLE B-101.—U.S. international t
- Page 285 and 286:
TABLE B-103.—U.S. merchandise exp
- Page 287 and 288:
TABLE B-105.—International invest
- Page 289 and 290:
TABLE B-107.— World trade balance
- Page 291 and 292:
TABLE B-109.—Growth rates in real
- Page 293:
TABLE B-lll.—Unemployment rate, a