

Economic Report of the President
Report - The American Presidency Project
Report - The American Presidency Project
- No tags were found...

Create successful ePaper yourself
Turn your PDF publications into a flip-book with our unique Google optimized e-Paper software.
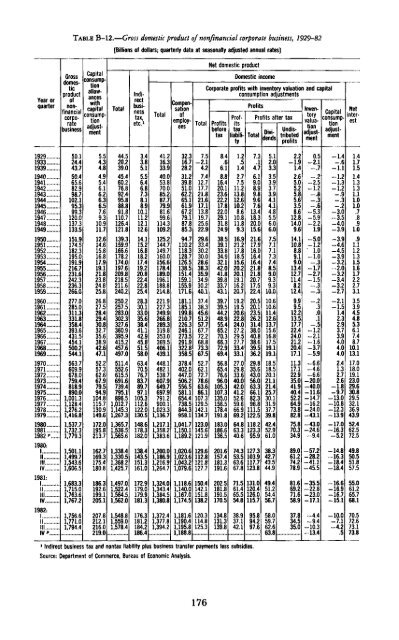
TABLE B-12.—Gross domestic product <strong>of</strong> nonfinancial corporate business, 1929-82[Billions <strong>of</strong> dollars; quarterly data at seasonally adjusted annual rates]Year orquarter1929193319391940194119421943194419451946194719481949195019511952195319541955195619571958195919601961196219631964196519661967196819691970197119721973197419751976197719781979198019811982"1980:ll"Z!Z!IllIV1981:1nZZZIIIIV1982:1IIIllIV "GrossHnmacdomesticproduct<strong>of</strong>nonfinancialcorporatebusiness50.124.443.750.465.682.998.7102.195.399.3120.0137.3133.5151.9174.5182.3195.0191.9216.7231.6242.3236.3266.0277.0285.0311.3331.8358.4393.6431.5454.1500.2544.1563.7609.9678.0759.4818.9890.01,001.31,128.41,276.21,416.81,537.71.732.31,779.31,501.11,499 71,543.61,606.51,683.31,715.01,763.61,767.21,756.61,771.01,794.4Capitalconsumptionallowanceswithcapitalconsumptionadjustment5.54.34.84.95.46.16.26.36.57.69.310.911.712.614.615.816.817.919.121.823.824.825.826.827.528.429.430.832.735.638.942.647.152.257.362.667.979.594.9104.8115.7130.9149.6172.0195.8213.7162.7169.3175.4180.8186.3192.6199.1205.1207.8212.1216.0219.0Total44.520,239.045.460.276.892,495.888.891.8110.7126.4121.8139.3159.9166.6178.2174.0197.6209.8218.5211.6240.2250.2257.5283.0302.3327.6360.9395.9415.2457.6497.0511.4552.6615.5691.6739.4795.1896.51,012.71,145.31,267.31,365.71,536.51,565.61,338.41,330.51,368.21,425.71,497.01,522.41,564.51,562.01,548.81,559.01,578.4Indirectbusinesstax,etc. 13.43.85.15.56.46.87.38.18.910.111.212.112.614.115.216.818.217.419.220.822.422.825.428.330.133.035.638.441.142.945.851.558.063.470.576.783.789.797.1105.3112.6122.0130.5148.6178.3182.0138.4143.5151.3161.0172.9179.0179.9181.3176.3181.2184.2186.4Total41.216.333.940.053.870.085.287.779.981.699.6114.3109.2125.2144.7149.7160.0156.6178.4189.0196.1188.8214.8221.9227.3249.9266.8289.3319.8353.0369.5406.1439.1448.1482.1538.7607.9649.7697.9791.2900.11,023.31,136.71,217.11,358.21,383.61,200.01,186.91,216.91,264.71,324.01,343.41,384.51,380.81.372.41,377.81,394.2Compensation<strong>of</strong>employees32.316.728.231.239.851.062.265.161.967.279.187.885.394.7110.2118.3128.7126.5138.5151.4159.1155.9171.6181.1185.1199.8210.7226.3246.1273.5291.9322.8358.5378.4402.0447.0506.2556.5581.1654.4738.5844.3958.11,041.71,150.11,189.21,020.61,023.61,043.21,079.61,118.61,140.01,167.01,174.51,181.61,190.41,195.81,188.8Net domestic productDomestic incomeCorporate pr<strong>of</strong>its with inventory valuation and capitalconsumption adjustmentsTotal7.5-2.14.27.412.717.721.821.617.113.819.725.622.929.633.430.230.028.638.335.934.930.240.137.438.345.651.257.767.772.268.873.367.552.762.172.778.663.686.1107.3129.5142.1134.7123.0145.6121.9129.6112.8121.8127.7150.4142.1151.8138.2120.3114.8125.3Pr<strong>of</strong>itsPr<strong>of</strong>itsbeforetax8.4.66.1B.B16.420.123.622.217.822.029.131.824.938.539.133.834.932.142.041.839.833.743.139.739.544.248.955.465.270.366.372.969.456.865.476.696.0105.3107.3135.0156.5178.4191.8183.0186.6136.5201.6157.4181.3191.6202.5181.8191.5170.5134.8131.3139.8Pr<strong>of</strong>itstaxliability1.2.51.42.77.511.213.812.610.28.610.811.89.316.921.217.818.515.620.220.119.116.220.719.219.520.622.824.027.229.527.733.433.127.029.833.640.042.041.252.659.666.969.264.863.340.674.353.563.667.871.561.465.554.838.937.142.1Pr<strong>of</strong>its after taxTotal7.3.14.76.19.08.99,89.67.613.418.320.015.621.617.916.016.416.421.821.820.717.522.420.520.123.526.231.438.040.838.639.536.229.835.643.056.063.366.182.396.8111.5122.5118.2123.395.9127.3103.9117.7123.8131.0120.4126.0115.795.894.297.6Dividends5.12.03.33.53.93.73.94.14.14.85.56.06.07.57.17.17.37.48.59.09.39.310.010.610.611.412.613.715.616.817.519.119.118.518.520.121.121.425.730.131.937.739.842.452.961.038.342.743.544.949.451.254.456J58.059.762.663.8Undistributedpr<strong>of</strong>its2.2-1.91.42.65.05.25.85.63.58.612.814.09.614.110.88.89.19.013.412.711.48.212.49.99.512.213.517.722.424.021.220.417.111.317.122.935.041.940.452.264.973.882.875.870.334.989.061.274.278.981.669.271.658.937.834.535.0Inventoryvaluationadjustment0.5-2.1-.7=.2-2.5-1.2— 8-'.Z-.6-5.3= 5.9-2.21.9-5.0-1.2' 1.0-1.0= .3-1.7-2.7-1.5-.3-=.3-.2 .3.0.1=.5-1.2-2.1-1.6-3.7-5.9-6.6-4.6-6.6=20.0=40.0-11.6-=14.7= 16.2-24.0-43.1-43.0-24.6"9.4-57.2-28.2-41.1-45.5-35.5-22.8-23.0-17.1-4.4-=9.4= 10.3-13.4Capitalconsumptionadjustment= 1.4= .6= 1.1-1.2-1.3= 1.2-.9-.3= .2=3.03 5=3.9=3.9=4.6-4.5-3.9-3.2-2.0=3.2=3.4-3.2-2.7=2.1-1.51.42.32.93.73.94.04.04.02.41.32.72.6=1.8-9.7-13.0= 10.8-12.3= 13.9-17.0= 16.3-5.2-14.8 16.3-18.4= 18.4-16.6-16.9= 16.7= 15.1-10.0= 7.1=4.2.5 Netinterest1.41.71,51.41.31.31.11.01.0.7.8.91.0.91.11.21.31.51.61.72.22.73.13.53.94.54.85.36.17.48.710.113.117.018.019.123.029.630.829.532.136.943,952.462.572.549.850.551.857.555.061.265.768.170.572.673.173.81 Indirect business tax and nontax liability plus business transfer payments less subsidies.Source: Department <strong>of</strong> Commerce, Bureau <strong>of</strong> <strong>Economic</strong> Analysis.176


