- Page 5:
CONTENTSPageECONOMIC REPORT OF THE
- Page 9 and 10:
ECONOMIC REPORT OF THE PRESIDENTTo
- Page 11 and 12:
Monetary policy will play a critica
- Page 13 and 14:
Interest Rates and the U.S. Trade D
- Page 15:
THE ANNUAL REPORTOF THECOUNCIL OF E
- Page 19 and 20:
CONTENTSPageCHAPTER 1. FROM RECESSI
- Page 21 and 22:
PageConclusions 122CHAPTER 6. REVIE
- Page 23 and 24:
CHAPTER 1From Recession to Recovery
- Page 25 and 26:
slowed somewhat in the 1970s regard
- Page 27 and 28:
nal GNP growth is reflected in a sl
- Page 29 and 30:
inflation. More specifically, the A
- Page 31 and 32:
inflation rate, or with a 12 percen
- Page 33 and 34:
1988, an increase of about one-four
- Page 35 and 36:
CHAPTER 2The Dual Problems of Struc
- Page 37 and 38:
frequently associated with poor hea
- Page 39 and 40:
Chart 2-2Distribution of Unemployme
- Page 41 and 42:
Chart 2-4Distribution of Unemployme
- Page 43 and 44:
These findings suggest several conc
- Page 45 and 46:
Wage RigidityA number of studies sh
- Page 47 and 48:
that these measures may have caused
- Page 49 and 50:
Most young people find jobs or leav
- Page 51 and 52:
to employers who hire youths. Tax c
- Page 53 and 54:
defined broadly to include individu
- Page 55 and 56:
ship between incomplete experience
- Page 57 and 58:
CHAPTER 3The United States in the W
- Page 59 and 60:
with 2.6 percent in the other Organ
- Page 61 and 62:
TABLE 3-1 .—Structure ofthe U.S.
- Page 63 and 64:
TABLE 3-2.—Trade balances by comm
- Page 65 and 66:
concentrate on doing what it does r
- Page 67 and 68:
the United States will depress pric
- Page 69 and 70:
Chart 3-3Real Exchange Rates Of Maj
- Page 71 and 72:
AN UNDERVALUED YEN?The explanations
- Page 73 and 74:
arily reduced the international com
- Page 75 and 76:
nancial markets. These transactions
- Page 77 and 78:
TABLE 3-6.—Economic performance b
- Page 79 and 80:
were undoubtedly a highly favorable
- Page 81 and 82:
of lenders that some debtors will n
- Page 83 and 84:
CHAPTER 4Increasing Capital Formati
- Page 85 and 86:
ate of net investment was required,
- Page 87 and 88:
able share in Japan and 56 percent
- Page 89 and 90:
During the 1970s, productivity grow
- Page 91 and 92:
MEASURING NATIONAL SAVINGDomestic s
- Page 93 and 94:
TAX RULES AND PERSONAL SAVINGMany e
- Page 95 and 96:
on consumption taxation might also
- Page 97 and 98:
Nevertheless, a number of economic
- Page 99 and 100:
tion permitted businesses to deprec
- Page 101 and 102:
A final problem under current tax l
- Page 103 and 104:
fleeted efforts to deal with proble
- Page 105 and 106:
egulation was probably not applicab
- Page 107 and 108:
Aeronautics Board, for example, the
- Page 109 and 110:
system resulted. Price controls, wh
- Page 111 and 112:
NGPA, both controlled and decontrol
- Page 113 and 114:
Price and allocation controls only
- Page 115 and 116:
nications industries through the re
- Page 117 and 118:
Several major pieces of legislation
- Page 119 and 120:
tempt to set cartel rates would be
- Page 121 and 122:
computer information and advertisin
- Page 123 and 124:
of computer technology to the payme
- Page 125 and 126:
trend by widening the sources and u
- Page 127 and 128:
changes. That is, members can arbit
- Page 129 and 130:
ceived to be a consequence of exces
- Page 131 and 132:
lowest point in the post-World War
- Page 133 and 134:
ing. Partly in response to the drop
- Page 135 and 136:
Chart 6-3Ratio of Consumer Installm
- Page 137 and 138:
Chart 6-4RATIO1.85Real Inventory/Sa
- Page 139 and 140:
percent increase in real defense pu
- Page 141 and 142:
8.8 percent in 1981. These declines
- Page 143 and 144:
housing. Borrowing by the nonfinanc
- Page 145 and 146:
orous competitor for credit as usur
- Page 147 and 148:
1982 their share had risen to over
- Page 149 and 150:
TABLE 6-9.—Economic outlook for 1
- Page 151:
A critical element in achieving hea
- Page 155 and 156:
LETTER OF TRANSMITTALCOUNCIL OF ECO
- Page 157 and 158:
Report to the President on the Acti
- Page 159 and 160:
ety of interagency and internationa
- Page 161:
ence J. Kotlikoff (Yale University)
- Page 165 and 166:
CONTENTSNATIONAL INCOME OR EXPENDIT
- Page 167 and 168:
B-70. Mortgage debt outstanding by
- Page 169 and 170:
NATIONAL INCOME OR EXPENDITURETABLE
- Page 171 and 172:
TABLE B-2.—Gross national product
- Page 173 and 174:
19291933193919401941194219431944194
- Page 175 and 176:
TABLE B-5.—Changes in GNP and GNP
- Page 177 and 178:
TABLE B-7.—Gross national product
- Page 179 and 180:
TABLE B-9.—Gross national product
- Page 181 and 182:
TABLE B-ll.—Gross national produc
- Page 183 and 184:
TABLE B-13.—Output, costs, and pr
- Page 185 and 186:
TABLE B-14.—Personal consumption
- Page 187 and 188:
TABLE B-16.—Gross and net private
- Page 189 and 190:
TABLE B-18.—Inventories and final
- Page 191 and 192:
TABLE B-20.—Relation of national
- Page 193 and 194:
TABLE B-21.—National income by ty
- Page 195 and 196:
TABLE B-22.—Sources of personal i
- Page 197 and 198:
TABLE B-24.—Total and per capita
- Page 199 and 200:
Year or quarterTotalTotalTABLE B-26
- Page 201 and 202:
POPULATION, EMPLOYMENT, WAGES, AND
- Page 203 and 204:
TABLE B-29.—Noninstitutional popu
- Page 205 and 206:
TABLE B-31.—Selected employment a
- Page 207 and 208:
TABLE B-33.—Civilian unemployment
- Page 209 and 210:
TABLE B-35.—Unemployment by reaso
- Page 211 and 212:
TABLE B-37.— Wage and salary work
- Page 213 and 214: TABLE B-39.—Average weekly earnin
- Page 215 and 216: TABLE B-41.—Changes in productivi
- Page 217 and 218: TABLE B-43-—Industrial production
- Page 219 and 220: TABLE B-45.—Capacity utilization
- Page 221 and 222: TABLE B-46.—New construction acti
- Page 223 and 224: TABLE B-48.—Nonfarm business expe
- Page 225 and 226: TABLE B-50.—Manufacturers' shipme
- Page 227 and 228: Year or monthAllitemsPRICESTABLE B-
- Page 229 and 230: TABLE B-53.—Consumer price indexe
- Page 231 and 232: TABLE B-55.—Changes in consumer p
- Page 233 and 234: TABLE B-57.—Producer price indexe
- Page 235 and 236: TABLE B-58.—Producer price indexe
- Page 237 and 238: TABLE B-59.—Producer price indexe
- Page 239 and 240: MONEY STOCK, CREDIT, AND FINANCETAB
- Page 241 and 242: TABLE B-63.—Commercial bank loans
- Page 243 and 244: TABLE B-64.—Total funds raised in
- Page 245 and 246: TABLE B-66.—Aggregate reserves of
- Page 247 and 248: TABLE B-67 .—Bond yields and inte
- Page 249 and 250: TABLE B-69.—Consumer installment
- Page 251 and 252: TABLE B-71-—Mortgage debt outstan
- Page 253 and 254: TABLE B-72.—Federal budget receip
- Page 255 and 256: TABLE B-74.—Relation of Federal G
- Page 257 and 258: TABLE B-76.—Federal Government re
- Page 259 and 260: TABLE B-78.—State and local gover
- Page 261 and 262: TABLE B-80.—Estimated ownership o
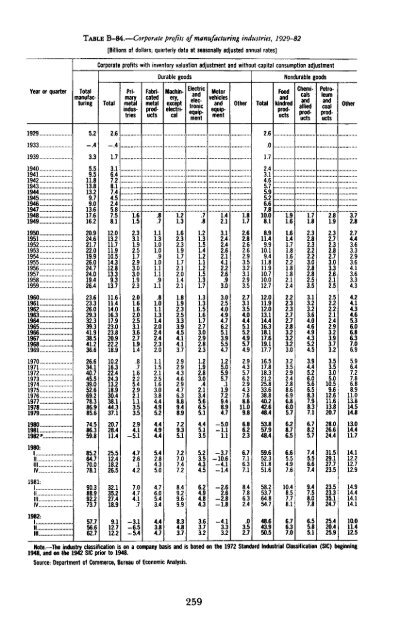
- Page 263: CORPORATE PROFITS AND FINANCETABLE
- Page 267 and 268: TABLE B-86.—Relation of profits a
- Page 269 and 270: TABLE B-88.—Determinants of busin
- Page 271 and 272: TABLE B-9Q.~Current assets and liab
- Page 273 and 274: TABLE B-92.—Common stock prices a
- Page 275 and 276: AGRICULTURETABLE B-94.—Farm incom
- Page 277 and 278: TABLE B-96.—Farm input use, selec
- Page 279 and 280: TABLE B-98.—U.S. exports and impo
- Page 281 and 282: INTERNATIONAL STATISTICSTABLE B-100
- Page 283 and 284: TABLE B-101.—U.S. international t
- Page 285 and 286: TABLE B-103.—U.S. merchandise exp
- Page 287 and 288: TABLE B-105.—International invest
- Page 289 and 290: TABLE B-107.— World trade balance
- Page 291 and 292: TABLE B-109.—Growth rates in real
- Page 293: TABLE B-lll.—Unemployment rate, a