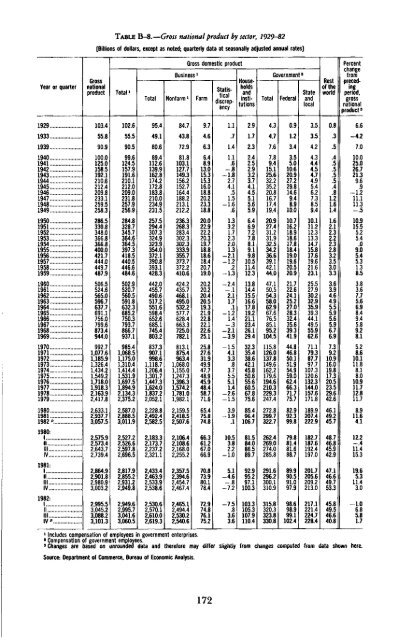
TABLE B-8.—Gross national product by sector, 1929-82[Billions <strong>of</strong> dollars, except as noted; quarterly data at seasonally adjusted annual rates]Year or quarterGrossnationalproductTotal 1TotalGross domestic productBusiness *Nonfarm 1FarmStatisticaldiscrepancyHouseholdsandinstitutionsTotalGovernmenFederal2StateandlocalRest<strong>of</strong> <strong>the</strong>worldPercentfromprecedperiod,grossnationalproduct 319291933193919401941...19421943194419451946194719481949...1950...19511952...195319541955 ..19561957...19581959..1960..19611962...1963196419651966196719681969197019711972... , ..197319741975..197619771978.19791980..19811982 p .1980:IIIIIIV1981:1IIIllIV....1982:IIllIV P103455.890.9100.0125 0158.5192.1210.6212 4209.82331259.5258.3286 5330.8348 0366 8366.8400 0421.7444 0449.7487.9506 5524.6565 0596.7637 7691.1756 0799.6873 4944.0992 71,077.61185 91,326.41434 21,549.21,718.01,918.32,163.92,417.82,633.12,937.73.057.52,575.92,573.42,643.72,739.42,864.92,901.82,980.93,003,22,995.53,045.23 088 23,101.3102.655.590.599.6124.5157.9191.6210.1212.0209.0231.8257.9256.9284.8328.7345.7364.6364.5397.3418.5440.5446.6484.65029520.7560.5591.8632.3685.2750.3793.7866.7937.198541,068.51,175.01,310.41,414.41,531.91,697.51,894.92,134.32,375.22,587.02,888.53,011.92,527.22,526.62,597.82,696.52.817.92,855.22,931.22,949.82,949.62,995.73,041.63,060.595.449.180.689.4112.6139.9162.8174.2172.8183.8210 0234.9231.5257 5294.4307.3324 9323.9354 0372.1390 8393.1428.3442 0455.7490 6517.25516598.4652.6685.17454803.2837 3907.1998 61,118.71206 41,301.71,447.31,624.01,837.22,052.12,228.82,492.42,582.52,183.32,173.72,237.22,321.12,433.42,463.92 533.92,538.62,530.62,570.12,610.02,619.384.743.872.981.8103.1127.7149.3156.2152.7164.4188 2213.1212.2236 3268.3283 4302 3302.3333 9355.7373 7372.2410.6424 2435.74681495.0532 2577.76284663.3725 0782.18131875.4963 41,068.01155 01,247.31,396.31,574.21,781.01,982.12,159.52,418.52,507.62,106.42.108.62,168.02,255.22,357.52,394.62 454 72,467.42,465.12,494.42 530.22,540.69.74.66.36.48.913.015.315.316.018.820.223.318.820.022.922.220.319.718.818.618.420.719.020 220.220 420.519 321.922.822.122.625.125 827.631949.947 748.945.948.458.771.665.475.874.866.361.267.066.970.873.980.178.472.974.876.175.21.1.71.41.1.6-.8-1.82.74.1.51.5-1.6.6133.21.7232.013-2.1-12.21324-.1211.71-1.21.4.3-2.1-3.9154.133.8375.55.11.4-2.6-1.53.91.9.110.53.82.2-1.05.1-4.6= .8-7.2-7.5.83.63.62.S1.72.32.42.52.93.23.74.14.55.15.65.96.46.97.27.88.19.19.810.511.412.313 814.415.516.617.819.221.123.426.129.432.335.438.642.145.850.655.660.567.875.685.496.4106.781.584.086.589.792.995.297.1100.3103.3105.3107.9110.44.34.77.67.89.415.125.632.235.220.816 717.419.420.927.431.231932.534.236.639142.144.047150.554 358.062.967.676.585.195.2104.5115 8126.0137 8149.6162 2179.6194.6210.3229.3247.4272.82997322.7262.4269.0274.0285.8291.6296.2300.1310.9315.8320.3323.8330.80.91.23.43.55.010.620.927.229.814.69.48.910.010.716.218.918.617.818.419.019.620.520.921.722.624.125.227.028.332.435.639.341.944.846.850.151.954.959.062.466.371.775.782.992.399.879.881.481.688.789.990.591.097.998.698.999.1102.43.53.54.24.34.44.54.74.95.46.27.38.59.410.111.212.313 314.715.817.619 621.623.125.527.930.232.935.939.344.149.555.962.671179.387.797.7107.3120.6132.3144.0157.6171.8189.9207.4222.9182.7187.6192.4197.0201.7205.6209.2213.0217.1221.4224.7228.41 Includes compensation <strong>of</strong> employees in government enterprises.8 Compensation <strong>of</strong> government employees.3 Changes are based on unrounded data and <strong>the</strong>refore may differ slightly from changes computed from data shown here.Source: Department <strong>of</strong> Commerce, Bureau <strong>of</strong> <strong>Economic</strong> Analysis.0.8.3.5.4•5.5.4.81.21.61.41.62.12.3222.32.83.23.53.03.33.63.94.64.95.55.95.65.96.76.97.39.210.916.019.817.320.523.529.642.646.149.245.748.746.845.942.947.146.649.753.345.849.546.640.86.6=4.27.010.025.026.721.39.6.9-=1.211.111.3= .510.915.55.254.0905.45.31.38.53.83.67.75.66.98.49.45.89.28.15.28.610.111.88.18.010.911.712.811.78.911.64.112.215.319.65.311.43.0-1.06.85.81.7172
TABLE B-9.—Gross national product by sector in 1972 dollars, 1929-82[Billions <strong>of</strong> 1972 dollars, except as noted; quarterly data at seasonally adjusted annual rates]Year or quarterPrrxeeUfOSSnationalproduct315.7222.1319.8344.1400.4461.7531.6569.1560.4478.3470.3489.8492.2534.8579.4600.8623.6616.1657.5671.6683.8680.9721.7737.2756.6800.3832.5876.4929.3984.81,011.41,058.11,087.61,085.61,122.41,185.91,254.31,246.31,231.61,298.21,369.71,438.61,479.41,474.01,502.61,475.51,494.91,457.81,463.81,479.41,507.81,502.21,510.41,490.11,470.71,478.41,481.11,471.7Gross domestic productTotal313.2220.9318.2342.8398.7460.1530.3567.7559.3476.4467.8486.8489.4531.8575.6596.9619.8612.1653.0666.5678.3676.2716.8732.0751.0793.8825.6868.9921.4977.51,003.91,050.01,079.71,077.61,112.81,175.01,239.21.229.01,217.81.282.61,352.81,418.71,453.21,447.91,477.21,453.21,466.41,431.01,438.11,456.01,482.81,477.81,485.01,463.31,448.01,454.11,458.61,452.2Business lTotal l271.5180.0261.0282.7327.6361.8385.6403.6397.9385.5393.8412.0409.8448.7478.0492.8515.6508.5547.0557.4566.1561.7600.0610.1625.1663.2691.6730.3777.7824.0842.0882.1907.1904.8938.6998.61,060.71,047.41,032.41,095.41,163.71,224.31,255.61,246.71,274.31,249.71,266.61,230.01,236.21,254.01,279.71,274.81,282.41,260.21,244.41,250.51,255.41,248.4Nonfarm 1244.7152.5231.3254.6299.8335.3362.1370.1362.8358.6367.0389.0383.4419.4447.2463.7484.3477.0516.0531.5539.5532.0574.0584.2596.3631.5659.7701.3749.6794.1812.8855.6881.9875.4901.7963.41,028.41,012.4994.51,059.51,129.51,193.51,222.41,210.31,236.81,210.11,224.91,192.61,200.91,222.61,242.91,240.91,241.91,221.51,210.01,212.21,214.41,204.0Farm23.624.925.224.526.228.627.727.125.625.824.025.825.627.025.826.427.728.429.328.928.229.327.829.228.928.829.628.829.828.229.529.029.531.132.631.931.631.833.632.133.132.634.234.238.439.635.635.334.032.034.136.340.942.338.138.039.342.8StatistiraiC3Idiscrepancy3.12.64.63.61.6-2.1-4.26.49.41.12.9-2.8.82.45.02.63.63.11.8-3.0-1.7.3-1.9-3.3-.22.92.3.2-1.61.7-.3-2.5-4.4-1.74.23.3.73.24.43.81.0-1.8-1.02.2-.9.06.12.11.2-.52.7-2.4-.4-3.6-3.7 .41.71.7Urn teanouseholdsandinstitutions15.612.215.116.115.916.415.215.115.015.116.016.717.318.318.718.619.319.421.422.523.124.224J26.627.028.128.929.830.932.634.335.437.036.737.638.639.439.340.540.941.543.344.645.846.948.145.345.446.046.446.846.746.747.447.847.948.048.6Government 2Total26.228.842.144.055.281.9129.4149.1146.475.958.058.162.364.779.085.585.084.184.686.789.190.392.295.398.9102.5105.2108.8112.7120.8127.7132.4135.7136.1136.7137.8139.1142.3144.9146.3147.7151.2153.0155.4156.0155.4154.4155.6155.9155.7156.3156.2155.9155.8155.7155.7155.2155.1Federal5.26.616.918.629.656.7105.0125.2121.849.729.829.231.332.746.251.649.647.245.945.645.844.544.545.246.248.348.248.548.753.057.258.058.255.252.550.148.248.548.448.548.649.349.049.549.749.849.049.849.849.449.649.749.849.849.849.849.849.9Stateandlocal21.022.125.225.425.625.224.523.924.626.228.229.031.032.032,833.935.436.938.641.043.345.847.750.152754.357.060.464.067.970.574.477.480.984.287.790.893.896.597.899.1101.9104.1105.9106.3105.6105.4105.8106.1106.3106.8106.5106.1106.0106.0105.9105.4105.3Rest<strong>of</strong> <strong>the</strong>world2.41.31.61.41.71.51.31.41.11.82.53.02.73.03.73.93.74.04.55.15.54.64.95.25.76.56.97.57.97.47.58.27.98.09.510.915.117.313.815.616.919.926.326.125.422.228.626.825.723.425.024.425.426.722.724.222.519.5Percentchangefromprecedingperiod,grossnationalproduct 36.6-2.27.87.616.315.315.17.1-1.5-14.7-1.74.1.58.78.33.73.8-1.26.72.11.8-.46.02.22.65.84.05.36.06.02.74.62.8-.23.45.75.8-.6-1.25.45.55.02.8-.41.9-1.81.5-9.61.64.37.9-1.52.2-5.3-5.12.1.7-2.5192919331939194019411942194319441945194619471948....19491950195119521953195419551956195719581959....196019611962....1963196419651966....196719681969....197019711972....1973....197419751976....1977 ....1978....1979....1980....1981....1982 »..1980:I IIIllIV1981:if.'.'."'.IllIV1982:if.'."'.!IllIV..1 Includes compensation <strong>of</strong> employees in government enterprises.2 Compensation <strong>of</strong> government employees.3 Changes are based on unrounded data and <strong>the</strong>refore may differ slightly from changes computed from data shown here.Source: Department <strong>of</strong> Commerce, Bureau <strong>of</strong> <strong>Economic</strong> Analysis.173
- Page 5:
CONTENTSPageECONOMIC REPORT OF THE
- Page 9 and 10:
ECONOMIC REPORT OF THE PRESIDENTTo
- Page 11 and 12:
Monetary policy will play a critica
- Page 13 and 14:
Interest Rates and the U.S. Trade D
- Page 15:
THE ANNUAL REPORTOF THECOUNCIL OF E
- Page 19 and 20:
CONTENTSPageCHAPTER 1. FROM RECESSI
- Page 21 and 22:
PageConclusions 122CHAPTER 6. REVIE
- Page 23 and 24:
CHAPTER 1From Recession to Recovery
- Page 25 and 26:
slowed somewhat in the 1970s regard
- Page 27 and 28:
nal GNP growth is reflected in a sl
- Page 29 and 30:
inflation. More specifically, the A
- Page 31 and 32:
inflation rate, or with a 12 percen
- Page 33 and 34:
1988, an increase of about one-four
- Page 35 and 36:
CHAPTER 2The Dual Problems of Struc
- Page 37 and 38:
frequently associated with poor hea
- Page 39 and 40:
Chart 2-2Distribution of Unemployme
- Page 41 and 42:
Chart 2-4Distribution of Unemployme
- Page 43 and 44:
These findings suggest several conc
- Page 45 and 46:
Wage RigidityA number of studies sh
- Page 47 and 48:
that these measures may have caused
- Page 49 and 50:
Most young people find jobs or leav
- Page 51 and 52:
to employers who hire youths. Tax c
- Page 53 and 54:
defined broadly to include individu
- Page 55 and 56:
ship between incomplete experience
- Page 57 and 58:
CHAPTER 3The United States in the W
- Page 59 and 60:
with 2.6 percent in the other Organ
- Page 61 and 62:
TABLE 3-1 .—Structure ofthe U.S.
- Page 63 and 64:
TABLE 3-2.—Trade balances by comm
- Page 65 and 66:
concentrate on doing what it does r
- Page 67 and 68:
the United States will depress pric
- Page 69 and 70:
Chart 3-3Real Exchange Rates Of Maj
- Page 71 and 72:
AN UNDERVALUED YEN?The explanations
- Page 73 and 74:
arily reduced the international com
- Page 75 and 76:
nancial markets. These transactions
- Page 77 and 78:
TABLE 3-6.—Economic performance b
- Page 79 and 80:
were undoubtedly a highly favorable
- Page 81 and 82:
of lenders that some debtors will n
- Page 83 and 84:
CHAPTER 4Increasing Capital Formati
- Page 85 and 86:
ate of net investment was required,
- Page 87 and 88:
able share in Japan and 56 percent
- Page 89 and 90:
During the 1970s, productivity grow
- Page 91 and 92:
MEASURING NATIONAL SAVINGDomestic s
- Page 93 and 94:
TAX RULES AND PERSONAL SAVINGMany e
- Page 95 and 96:
on consumption taxation might also
- Page 97 and 98:
Nevertheless, a number of economic
- Page 99 and 100:
tion permitted businesses to deprec
- Page 101 and 102:
A final problem under current tax l
- Page 103 and 104:
fleeted efforts to deal with proble
- Page 105 and 106:
egulation was probably not applicab
- Page 107 and 108:
Aeronautics Board, for example, the
- Page 109 and 110:
system resulted. Price controls, wh
- Page 111 and 112:
NGPA, both controlled and decontrol
- Page 113 and 114:
Price and allocation controls only
- Page 115 and 116:
nications industries through the re
- Page 117 and 118:
Several major pieces of legislation
- Page 119 and 120:
tempt to set cartel rates would be
- Page 121 and 122:
computer information and advertisin
- Page 123 and 124:
of computer technology to the payme
- Page 125 and 126:
trend by widening the sources and u
- Page 127 and 128: changes. That is, members can arbit
- Page 129 and 130: ceived to be a consequence of exces
- Page 131 and 132: lowest point in the post-World War
- Page 133 and 134: ing. Partly in response to the drop
- Page 135 and 136: Chart 6-3Ratio of Consumer Installm
- Page 137 and 138: Chart 6-4RATIO1.85Real Inventory/Sa
- Page 139 and 140: percent increase in real defense pu
- Page 141 and 142: 8.8 percent in 1981. These declines
- Page 143 and 144: housing. Borrowing by the nonfinanc
- Page 145 and 146: orous competitor for credit as usur
- Page 147 and 148: 1982 their share had risen to over
- Page 149 and 150: TABLE 6-9.—Economic outlook for 1
- Page 151: A critical element in achieving hea
- Page 155 and 156: LETTER OF TRANSMITTALCOUNCIL OF ECO
- Page 157 and 158: Report to the President on the Acti
- Page 159 and 160: ety of interagency and internationa
- Page 161: ence J. Kotlikoff (Yale University)
- Page 165 and 166: CONTENTSNATIONAL INCOME OR EXPENDIT
- Page 167 and 168: B-70. Mortgage debt outstanding by
- Page 169 and 170: NATIONAL INCOME OR EXPENDITURETABLE
- Page 171 and 172: TABLE B-2.—Gross national product
- Page 173 and 174: 19291933193919401941194219431944194
- Page 175 and 176: TABLE B-5.—Changes in GNP and GNP
- Page 177: TABLE B-7.—Gross national product
- Page 181 and 182: TABLE B-ll.—Gross national produc
- Page 183 and 184: TABLE B-13.—Output, costs, and pr
- Page 185 and 186: TABLE B-14.—Personal consumption
- Page 187 and 188: TABLE B-16.—Gross and net private
- Page 189 and 190: TABLE B-18.—Inventories and final
- Page 191 and 192: TABLE B-20.—Relation of national
- Page 193 and 194: TABLE B-21.—National income by ty
- Page 195 and 196: TABLE B-22.—Sources of personal i
- Page 197 and 198: TABLE B-24.—Total and per capita
- Page 199 and 200: Year or quarterTotalTotalTABLE B-26
- Page 201 and 202: POPULATION, EMPLOYMENT, WAGES, AND
- Page 203 and 204: TABLE B-29.—Noninstitutional popu
- Page 205 and 206: TABLE B-31.—Selected employment a
- Page 207 and 208: TABLE B-33.—Civilian unemployment
- Page 209 and 210: TABLE B-35.—Unemployment by reaso
- Page 211 and 212: TABLE B-37.— Wage and salary work
- Page 213 and 214: TABLE B-39.—Average weekly earnin
- Page 215 and 216: TABLE B-41.—Changes in productivi
- Page 217 and 218: TABLE B-43-—Industrial production
- Page 219 and 220: TABLE B-45.—Capacity utilization
- Page 221 and 222: TABLE B-46.—New construction acti
- Page 223 and 224: TABLE B-48.—Nonfarm business expe
- Page 225 and 226: TABLE B-50.—Manufacturers' shipme
- Page 227 and 228: Year or monthAllitemsPRICESTABLE B-
- Page 229 and 230:
TABLE B-53.—Consumer price indexe
- Page 231 and 232:
TABLE B-55.—Changes in consumer p
- Page 233 and 234:
TABLE B-57.—Producer price indexe
- Page 235 and 236:
TABLE B-58.—Producer price indexe
- Page 237 and 238:
TABLE B-59.—Producer price indexe
- Page 239 and 240:
MONEY STOCK, CREDIT, AND FINANCETAB
- Page 241 and 242:
TABLE B-63.—Commercial bank loans
- Page 243 and 244:
TABLE B-64.—Total funds raised in
- Page 245 and 246:
TABLE B-66.—Aggregate reserves of
- Page 247 and 248:
TABLE B-67 .—Bond yields and inte
- Page 249 and 250:
TABLE B-69.—Consumer installment
- Page 251 and 252:
TABLE B-71-—Mortgage debt outstan
- Page 253 and 254:
TABLE B-72.—Federal budget receip
- Page 255 and 256:
TABLE B-74.—Relation of Federal G
- Page 257 and 258:
TABLE B-76.—Federal Government re
- Page 259 and 260:
TABLE B-78.—State and local gover
- Page 261 and 262:
TABLE B-80.—Estimated ownership o
- Page 263 and 264:
CORPORATE PROFITS AND FINANCETABLE
- Page 265 and 266:
Year or quarterTABLE B-84.—Corpor
- Page 267 and 268:
TABLE B-86.—Relation of profits a
- Page 269 and 270:
TABLE B-88.—Determinants of busin
- Page 271 and 272:
TABLE B-9Q.~Current assets and liab
- Page 273 and 274:
TABLE B-92.—Common stock prices a
- Page 275 and 276:
AGRICULTURETABLE B-94.—Farm incom
- Page 277 and 278:
TABLE B-96.—Farm input use, selec
- Page 279 and 280:
TABLE B-98.—U.S. exports and impo
- Page 281 and 282:
INTERNATIONAL STATISTICSTABLE B-100
- Page 283 and 284:
TABLE B-101.—U.S. international t
- Page 285 and 286:
TABLE B-103.—U.S. merchandise exp
- Page 287 and 288:
TABLE B-105.—International invest
- Page 289 and 290:
TABLE B-107.— World trade balance
- Page 291 and 292:
TABLE B-109.—Growth rates in real
- Page 293:
TABLE B-lll.—Unemployment rate, a