

Economic Report of the President
Report - The American Presidency Project
Report - The American Presidency Project
- No tags were found...

You also want an ePaper? Increase the reach of your titles
YUMPU automatically turns print PDFs into web optimized ePapers that Google loves.
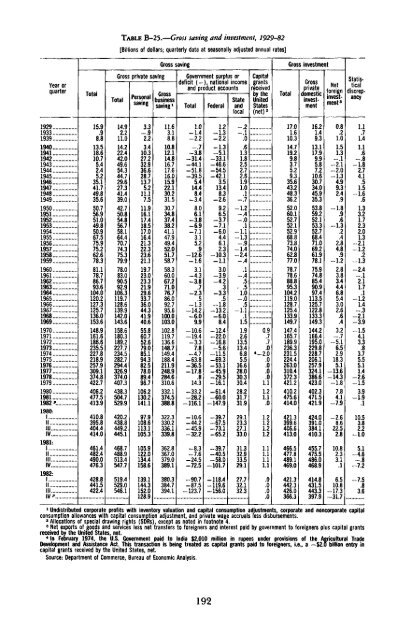
TABLE B-25.—Gross saving and investment, 1929-82[Billions <strong>of</strong> dollars; quarterly data at seasonally adjusted annual rates]Gross savingGross investmentYear orquarterTotalGross private savingTotalPersonalsavingGrossbusinesssaving'Governrnent surplus or), national incomeand pr3duct accountsTotalFederalStateandtocalCapita)grantsreceivedby <strong>the</strong>unitedStates(net) 2TotalGrossprivatedomesticinvestmentNetforeigninvestment*Statisticaldiscrepancy19291933193919401941194219431944194519461947194819491950195119521953...1954195519561957195819591960196119621963196419651966196719681969197019711972197319741975197619771978197919801981...1982 p ,1980:|||IIIIV1981:(IIllIV1982:I||IllIV P15.9.98.813.518.610 7542.45.235.141.749.835.650 756.951.049.850.967.575.975.262.678.381.178.786.793.6104.0120.2127.3125 7136.0153.6148.9161.6186.6235.5227 8218.9257.9309.1374.8422.7406.2477.5413.9410.8395.8404.4414.0461.4482.4490.0476.3428.8441.5422.414.92.211.014.222.442.049 654.344.729.627.341.439.042 750.854.856.758.164.470.774.375.379.978.083.090.592.9106.3119.7128.6139 9142.0143.6158.6180.3189.2227.7234 5282.7294 4326.9374.0407.3438.3504.7529.9420.2438.8449.2445.1468.7488.9513.4547.7519.4529.0546.133-.92.23.410.327 232936.628.713.75.211.17.511916.117 418.517.016.421.322.323.621.119.723.023.321.929 633.736.044 341.940.655.860 752,679.085194.382 578.089 496.7106 2130.2141.197.9108.6113.1105.3105.9122.0134.4158.61391144 3152.0128.91163.18.810.812.114 816 717.616.015.922.130 231.530 734.837.438.241147.949.452.051758.758.360.067.271.076 786.092.795 6100.0103.0102.8119 7136.6148.71494188.42119248.9284 6310.63321374.5388.8322.3330.2336.1339.8362.8367.0379.0389.1380 3384 7394.110-1.4=2.27=3.8=314—44 1-51.8-39.55414.484-3.4806.1-38-6.9-713.152.9= 12 6-1.63.1-4.3-3.8-2 3.5-1.3— 142-6.09.9= 10.6= 19 4-3.37.8-4 7-63.8-36 5-17.8814.3-33 2=28.2= 116.1-10.6-44.2-45.9= 32.2-8.3-7.6-24.5-72.5=90 7—87 5= 123.71.2-1.3-2.2-1.3=5.1=33.1=46.6-54.5=42.13.513.48.3-2.69.26.5-3.7-7.1-6.04.46.12.3= 10.3-1.13.0= 3.9=4.2-13-l!8= 132-6.08.4"12.4-?2.0= 16.8= 5.6115-69.3-531-45.9-29.5-16.1-614=60.0= 147.9-39.7=67.5-73.1-65.2-39.7-40.5= 58.0= 101.7— 1184= 1196-156.0— 2= .1.0.61.31.8252.72.61.91.0,1-1.2= .4-.0-1.113-.9-1.4-2.4-.4.1= .4.510= .011.11.51.92613.513.4685.516 628.030 330.428231.731.929.123.327.133.031.332.933.529.121132132.3ZZZ40.9 .7.7.020.00.001.1121.1.01.21.21.21.21.11.11.11.100.0.017 01.610.314.719.298375.29.335.643.248.336.252.060.152.752.152.968.873.874.062.877.078.778.688.895.3104 2119.0128.7125 4133.9149.7147.4165 7189.9236.32315224.4263 0310.4372 3421.2410 2475.6414.0421.3399.6406.6413.0466.5477.8489.1469.04213442 3426.0366.316.21.49.313.117.99.9587.210.630.734.045.935.353.859.252.153.352.768.471.069.261.978.175.974.885.490.997.4113.5125.7122.8133.3149.3144.2166.4195.0229.8228.7206.1257.9324.1386.6423.0402.3471.5421.9424.0391.0384.1410.3455.7475.5486.0468.9414 84315443.3397.90.8.21.01.51.3=.121-2.0-1.34.99.32.4.9-1.8.9.6=1.3.42.84.8.9-1.22.83.83.44.46.85.43.02.6.6.43.2= 7516.52.918.35.1= 13.6= 14.3-1.87.84.1=7.9=2.68.622.52.810.82.33.16510 8= 17.3=31.71.1\A1.1 .6=.8182,74.1.51.5-1.6.61.33.21.72.32.01.3-2.1-1.2.2-1.3=2.4l.'l1.71 Undistributed corporate pr<strong>of</strong>its with inventory valuation and capital consumption adjustments, corporate and noncorporate capitalconsumption allowances with capital consumption adjustment, and private wage accruals less disbursements.2 Allocations <strong>of</strong> special drawing rights (SDRs), except as noted in footnote 4.3 Net exports <strong>of</strong> goods and services less net transfers to foreigners and interest paid by government to foreigners plus capital grantsreceived by <strong>the</strong> United States, net.4 In February 1974, <strong>the</strong> U.S. Government paid to India $2,010 million in rupees under provisions <strong>of</strong> <strong>the</strong> Agricultural TradeDevelopment and Assistance Act. This transaction is being treated as capital grants paid to foreigners, i.e., a $2.0 billion entry incapital grants received by <strong>the</strong> United States, net.Source: Department <strong>of</strong> Commerce, Bureau <strong>of</strong> <strong>Economic</strong> Analysis.121.4=2.1= 3.9-1.54.13.3.8375.55.11.4=2.6= 1.53.9-1.910.53.82.2-1.05.1=4.6 g7 275 83.6192


