

Economic Report of the President
Report - The American Presidency Project
Report - The American Presidency Project
- No tags were found...

You also want an ePaper? Increase the reach of your titles
YUMPU automatically turns print PDFs into web optimized ePapers that Google loves.
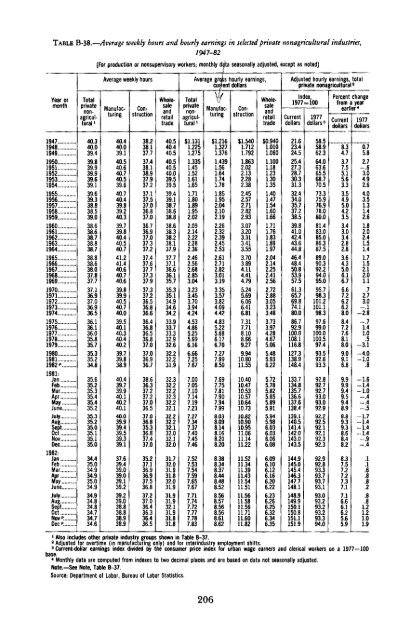
TABLE B-38.—Average weekly hours and hourly earnings in selected private nonagrieulturalYear ormonth194719481949195019511952195319541955195619571958195919601961196219631964196519661967196819691970197119721973197419751976197719781979198019811982"....1981:JanFebMartz.June....JulyAugNov."!.'.'Dec1982:JanFebMarMay'."."June....JulyAugSept....OctNov...Dec "...Totalprivatenonagricultural>40.340.039.439.839.939.939.639.139.639.338.838.539.038.638.638.738.838.738.838.638.037.837.737.136.937.036.936.536.136.136.035.835.735.335.234.835.635.235.335.435.435.235.335.235.035.135.135.034.435.034.934.935.034.934.934.834.834.734.734.61947-82[For production or nonsupervisory workers; monthly data seasonally adjusted, except as noted]Average weekly hours40.440.039.140.540.640.740.539.640.740.439.839.240.339.739.840.440.540.741.241.440.640.740.639.839.940.540.740.039.540.140.340.440.239.739.838.940.439.739.940.140.240.140.039.939.439.539.339.137.639.439.039.039.139.239.239.038.838.838.938.938.238.137.737.438.138.937.937.237.137.537.036.837.036.736.937.037.337.237.437.637.737.337.937.337.236.536.836.636.436.836.536.837.037.036.936.738.636.337.237.237.036.537.036.835.336.837.437.035.237.136.936.937.536.837.237.036.436.336.436.5ManufacturingConstructionWholesaleandretailtrade40.540.440.540.540.540.039.539.539.439.138.738.638.838.638.338.238.137.937.737.136.636.135.735.335.134.934.634.233.933.733.332.932.632.232.231.932.332.232.232.332.232.132.232.232.132.032.132.031.732.031.931.832.031.931.931.932.131.931.831.8Totalprivatenonagriculturalx$1,1311.2251.2751.3351.451.521.611.651.711.801.891.952.022.092.142.222.282.362.462.562.682.853.043.233.453.703.944.244.534.865.255.696.166.667.257.677.007.057.107.147.197.237.277.347.377.407.457.467.527.537.547.597.657.677.717.747.727.777.787.83Average gross hourly earnings,current dollars$1,2161.3271.3761.4391.561.641.741.781.851.952.042.102.192.262.322.392.452.532.612.712.823.013.193.353.573.824.094.424.835.225.686.176.707.277.998.507.697.757.817.907.947.998.038.098.148.168.208.208.388.348.378.448.488.528.568.578.568.568.618.62$1,5401.7121.7921.8632.022.132.282.382.452.572.712.822.933.073.203.313.413.553.703.894.114.414.795.245.696.066.416.817.317.718.108.669.279.9410.8011.5510.4010.4710.5310.5710.6410.7310.8210.9010.9511.0611.1411.2211.5211.3411.3911.4311.5411.5111.5611.5811.5611.7111.6011.82ManufacturingConstructionWholesaleandretailtrade$0,9401.0101.0601.1001.181.231.301.351.401.471.541.601.661.711.761.831.891.972.042.142.252.412.562.722.883.053.233.483.733.974.284.675.065.485.936.225.725.785.825.855.895.915.945.986.036.036.066.086.096.106.126.166.206.226.236.266.256.326.346.35industries,Adjusted hourly earnings, totalprivate nonagricultura! 2Index,1977^100Currentdollars21.623.424.525.427.328.730.331.332.434.035.737.238.539.841.042.443.644.846.448.450.853.957.561.365.769.874.180.086.792.9100.0108.1116.8127.3138.9148.4133.7134.8135.7136.6137.6138.4139.1140.5141.4142.0143.0143.5144.9145.0145.4146.3147.7148.1148.9149.9150.1150.8151.1151.91977dollars 358.558.962.364.063.665.568.770.573.375.976.978.080.081.483.085.086.387.589.090.392.294.095.095.798.3101.2101.198.397.699.0100.0100.597.493.592.693.392.892.792.793.093.092.992.292.592.192.192.392.392.992.893.393.793.793.193.093.293.293.293.394.0Percent changefrom a yearearlier 4Currentdollars1 Also includes o<strong>the</strong>r private industry groups shown in Table B-37.2 Adjusted for overtime (in manufacturing only) and for interindustry employment shifts.3 Current-dollar earnings index divided by <strong>the</strong> consumer price index for urban wage earners and clerical workers on a 1977=100base.4 Monthly data are computed from indexes to two decimal places and are based on data not seasonally adjusted.Note.—See Note, Table B-37.Source: Department <strong>of</strong> Labor, Bureau <strong>of</strong> Labor Statistics.8.34.73.77.55.15.63.33.54.95.04.23.53.43.03.42.82.83.64.35.06.16.76.67.26.26.28.08.47.27.68.18.09.09.16.89.99.99.49.59.48.93.89.39.38.68.48.28.37.57.27.27.37.17.16.66.16.25.65.9206


