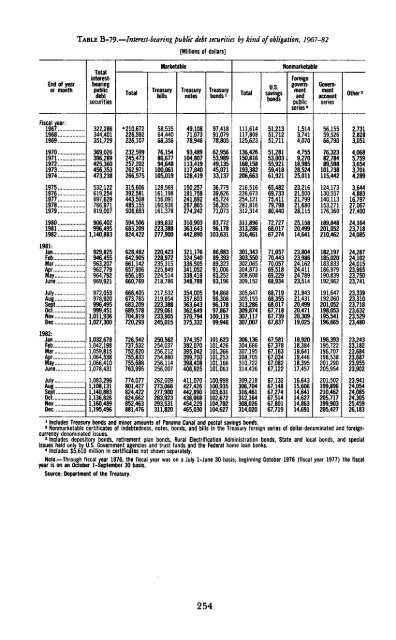
TABLE B-79.—Interest-bearing public debt securities by kind <strong>of</strong> obligation, 1967-82[Millions <strong>of</strong> dollars]End <strong>of</strong> yearor monthTotalinterestbearingpublicdebtsecuritiesTotalMarketableTreasuryTreasurynotesTreasurybonds'TotalU.S.savingsbondsNonmarketableForeigngovernmentandpublicseries 2GovernmentaccountseriesO<strong>the</strong>r*Fiscal year:196)1968196919701971197219731974322,286344,401351,729369,026396,289425,360456,353473,238* 210,672226,592226,107232,599245,473257,202262,971266,57558,53564,44068,35676,15486,67794,648100,061105,01949,10871,07378,94693,489104,807113,419117,840128,41997,41891,07978,80562,95653,98949,13545,07133,137111,614117,808125,623136,426150,816168,158193,382206,66351,21351,71251,71151,28153,00355,92159,41861,9211,5143,7414,0704,7559,27018,98528,52425,01156,15559,52666,79076,32382,784101,738115,4422,7312,8283,0514,0685,7593,6543,7014,28919751976197719781979532,122619,254697,629766,971819,007315,606392,581443,508485,155506,693128,569161,198156,091160,936161,378150,257191,758241,692267,865274,24236,77939,62645,72456,35571,073216,516226,673254,121281,816312,31465,48269,73375,41179,79880,44023,21621,50021,79921,68028,115124,173130,557140,113153,271176,3603,6444,88316,79727,06727,400198019811982906,402996,4951,140,883594,506683,209824,422199,832223,388277,900310,903363,643442,89083,77296,178103,631311,896313,286316,46172,72768,01767,27425,15820,49914,641189,848201,052210,46224,16423,71824,0851981:JanFebMarAprMayJuneJulyAugSeptOctNovDec1982:JanFebMarJuneJulyAugSept....OtiNovDec929,825946,455963,207962,779964,792969,921972,053978,920996,495999,4511,011,9361.027,3001,032,6781,042,1981,059,8151,064,5381,066,4101,078,4311,083,2961,108,1311,140,8831,136,8261,160,4891,195,496628,482642,905661,142657,906656,185660,769666,405673,765683,209689,578704,819720,293726,542737,532752,620755,833755,688763,995774,077801,427824,422824,662852,463881,476220,423228,972235,315225,849224,514218,786217,532219,854223,388229,061233,905245,015250,562254,037256,212254,880256,114256,007262,009273,066277,900283,923293,531311,820321,176324,540336,505341,052338,419348,788354,005357,603363,643362,649370,794375,332374,357382,070395,042399,700398,408406,925411,070427,426442,890438,068454,229465,03086,88389,39389,32391,00693,25293,19694,86896,30896,17897,867100,11999,946101,623101,426101,366101,253101,166101,063100,998100,935103,631102,672104,702104,627301,343303,550302,065304,873308,608309,152305,647305,155313,286309,874307,117307,007306,136304,666307,195308,705310,722314,436309,218306,704316,461312,164308,026314,02071,05770,44370,05769,51869,22968,93468,71968,35568,01767,71867,73967,83767,58167,37867,16367,03467,08267,12267,13267,14867,27467,51467,80167,71923,80423,98624,16224,41124,78923,51421,94321,43120,49920,47120,30919,02518,92018,38419,64119,44618,39517,45716,64315,60614,64114,62714,86314,691182,197185,020183,833186,979190,839192,962191,647192,060201,052198,053195,541196,665196,393195,722196,707198,538201,290205,954201,502199,896210,462205,717199,903205,42724,28724,10224,01523,96523,75023,74123,33923,31023,71823,63223,52923,48023,24323,18223,68423,68723,95523,90223,94124,05424,08524,30525,45926,1831 Includes Treasury bonds and minor amounts <strong>of</strong> Panama Canal and postal savings bonds.3 Nonmarketable certificates <strong>of</strong> indebtedness, notes, bonds, and bills in <strong>the</strong> Treasury foreign series <strong>of</strong> dollar-denominated and foreigncurrencydenominated issues.3 Includes depository bonds, retirement plan bonds, Rural Electrification Administration bonds, State and local bonds, and specialissues held only by U.S. Government agencies and trust funds and <strong>the</strong> Federal home loan banks.4 Includes $5,610 million in certificates not shown separately.Note.—Through fiscal year 1976, <strong>the</strong> fiscal year was on a July 1-June 30 basis; beginning October 1976 (fiscal year 1977) <strong>the</strong> fiscalyear is on an October 1-September 30 basis.Source: Department <strong>of</strong> <strong>the</strong> Treasury.254
TABLE B-80.—Estimated ownership <strong>of</strong> public debt securities, 1967-82[Par values;' billions <strong>of</strong> dollars]1'ublic debt securitiesHeld by private investorsEnd <strong>of</strong> year or monthTotal 2Held byGovernmentaccountsHeld byFederalReserveBanksTotal 3Commercialbanks 4MutualsavingsbanksandinsurancecompaniesCorporations6State andlocalgovernments6Individuals7Miscellaneousinvestors38Fiscal year:196719681969322.9345.4352.971.876.184.846.752.254.1204.4217.0214.055.559.755.313.212.511.611.012.011.123.625.126.470.474.277.330.733.432.319701971197219731974370.1397.3426.4457.3474.295.2102.9111.5123.4138.257.765.571.475.080.5217.2228.9243.6258.9255.652.661.060.958.853.210.410.310.29.68.58.57.49.39.810.829.025.926.928.828.381.875.473.275.980.735.049.163.276.074.219751976197719781979 .. .533.2620.4698.8771.5826.5145.3149.6155.5167.9187.784.794.4104.7115.3115.5303.2376.4438.6488.3523.469.092.599.894.492.510.616.020.521.221.513.824.721.218.122.131.739.348.263.866.586.896.2106.5113.9115.591.3107.7142.4176.9205.3198019811982907.7997.91,142.0197.7208.1216.4120.7124.3134.4589.2665.4791.2109.7112.224.326.225.937.877.086.2123.0140.3229.3262.71981:JanFebMarAprMayJune . .- 934.1950.5964.5964.0968.5971.2189.5192.0190.9193.9197.8199.9117.2118.9119.0119 7118.3120.0627.4639.6654.6650.4652.3651.2117.2116.4117.5113.5113.2113.325.525.323.723.725.324.030.435.240.040.438.838.777.380.482.383.685.183.0134.2136.2138.6138.2139.9139.6242.8246.1252.5251.0250.0252.6JulyAugSept ....OctNovDec973.3980.2997.91,005.01,013.31,028.7198.6199.0208.1204.9202.1203.3123.4124 5124.3123.0126.5129.9651.3656.7665.4677.2684.6694.5114.2115.0112.2111.3110.0109.425.426.126.224.724.624.337.838.037.838.638.337.886.086.286.288.387.585.6139.5140.2140.3141.0141.6143.7248.4251.2262.7273.3282.6293.71982:JanFebMarAprMayJune1,038.41048.21 061.31 065.71 071.71,079.6202.82011202.5204.3206 7211.7128 3126 2125 6134 3129 8127.0707.3720 8733.3727.1735.2740.9111.41118114.3110.1109.4117.024.924 125.626.827.227.937.937.537.536.538.838.986.288.288.388.591.891.2144.1144.7146.5145.7146.2146.2302.8314.5321.1319.5321.8319.7JulyAug ..sept ..::::;•;OctNovDec1,089.61,109.21,142.01,142.81,161.71,197.1206.3206.5216.4211.0203.9209.4133.8132.9134.4132.1137.7139.9749.6769.8791.2799.7820.1849.4110.028.239.988.7146.4336.41 U.S. savings bonds, series A-F and J, and U.S. savings notes are included at current redemption value.2 As <strong>of</strong> July 31, 1974, public debt outstanding has been adjusted to exclude <strong>the</strong> notes <strong>of</strong> <strong>the</strong> International Monetary Fund to conformwith <strong>the</strong> Budget presentation. This adjustment applies to <strong>the</strong> 1967-82 data in this table.3 For comparability with 1975-82 published data, published data for 1967-74 have been adjusted to exclude notes <strong>of</strong> <strong>the</strong>International Monetary Fund. These adjustments amounted to $3.3 billion in 1967, $2.2 billion in 1968, and $0.8 billion in each year1969 through 1974. These adjustments were necessary in order to add to <strong>the</strong> total public debt figures as published by <strong>the</strong> Department<strong>of</strong> <strong>the</strong> Treasury. The Treasury Survey <strong>of</strong> Ownership on which private investor group estimates were based was discontinued in July 1982.4 Includes commercial banks, trust companies, and stock savings banks in <strong>the</strong> United States and Territories and island possessions;figures exclude securities held in trust departments.5 Exclusive <strong>of</strong> banks and insurance companies.8 Includes trust, sinking, and investment funds <strong>of</strong> State and local governments and <strong>the</strong>ir agencies, and <strong>of</strong> Territories and possessions.7 Includes partnerships and personal trust accounts.6 Includes savings and loan associations, nonpr<strong>of</strong>it institutions, corporate pension trust funds, dealers and brokers, certajngovernment deposit accounts and government-sponsored agencies, and investments <strong>of</strong> foreign balances and international accounts in<strong>the</strong> United States.Note.—Through fiscal year 1976, <strong>the</strong> fiscal year was on a July 1—June 30 basis; beginning October 1976 (fiscal year 1977), <strong>the</strong>fiscal year is on an October 1—September 30 basis.Source: Department <strong>of</strong> <strong>the</strong> Treasury.255
- Page 5:
CONTENTSPageECONOMIC REPORT OF THE
- Page 9 and 10:
ECONOMIC REPORT OF THE PRESIDENTTo
- Page 11 and 12:
Monetary policy will play a critica
- Page 13 and 14:
Interest Rates and the U.S. Trade D
- Page 15:
THE ANNUAL REPORTOF THECOUNCIL OF E
- Page 19 and 20:
CONTENTSPageCHAPTER 1. FROM RECESSI
- Page 21 and 22:
PageConclusions 122CHAPTER 6. REVIE
- Page 23 and 24:
CHAPTER 1From Recession to Recovery
- Page 25 and 26:
slowed somewhat in the 1970s regard
- Page 27 and 28:
nal GNP growth is reflected in a sl
- Page 29 and 30:
inflation. More specifically, the A
- Page 31 and 32:
inflation rate, or with a 12 percen
- Page 33 and 34:
1988, an increase of about one-four
- Page 35 and 36:
CHAPTER 2The Dual Problems of Struc
- Page 37 and 38:
frequently associated with poor hea
- Page 39 and 40:
Chart 2-2Distribution of Unemployme
- Page 41 and 42:
Chart 2-4Distribution of Unemployme
- Page 43 and 44:
These findings suggest several conc
- Page 45 and 46:
Wage RigidityA number of studies sh
- Page 47 and 48:
that these measures may have caused
- Page 49 and 50:
Most young people find jobs or leav
- Page 51 and 52:
to employers who hire youths. Tax c
- Page 53 and 54:
defined broadly to include individu
- Page 55 and 56:
ship between incomplete experience
- Page 57 and 58:
CHAPTER 3The United States in the W
- Page 59 and 60:
with 2.6 percent in the other Organ
- Page 61 and 62:
TABLE 3-1 .—Structure ofthe U.S.
- Page 63 and 64:
TABLE 3-2.—Trade balances by comm
- Page 65 and 66:
concentrate on doing what it does r
- Page 67 and 68:
the United States will depress pric
- Page 69 and 70:
Chart 3-3Real Exchange Rates Of Maj
- Page 71 and 72:
AN UNDERVALUED YEN?The explanations
- Page 73 and 74:
arily reduced the international com
- Page 75 and 76:
nancial markets. These transactions
- Page 77 and 78:
TABLE 3-6.—Economic performance b
- Page 79 and 80:
were undoubtedly a highly favorable
- Page 81 and 82:
of lenders that some debtors will n
- Page 83 and 84:
CHAPTER 4Increasing Capital Formati
- Page 85 and 86:
ate of net investment was required,
- Page 87 and 88:
able share in Japan and 56 percent
- Page 89 and 90:
During the 1970s, productivity grow
- Page 91 and 92:
MEASURING NATIONAL SAVINGDomestic s
- Page 93 and 94:
TAX RULES AND PERSONAL SAVINGMany e
- Page 95 and 96:
on consumption taxation might also
- Page 97 and 98:
Nevertheless, a number of economic
- Page 99 and 100:
tion permitted businesses to deprec
- Page 101 and 102:
A final problem under current tax l
- Page 103 and 104:
fleeted efforts to deal with proble
- Page 105 and 106:
egulation was probably not applicab
- Page 107 and 108:
Aeronautics Board, for example, the
- Page 109 and 110:
system resulted. Price controls, wh
- Page 111 and 112:
NGPA, both controlled and decontrol
- Page 113 and 114:
Price and allocation controls only
- Page 115 and 116:
nications industries through the re
- Page 117 and 118:
Several major pieces of legislation
- Page 119 and 120:
tempt to set cartel rates would be
- Page 121 and 122:
computer information and advertisin
- Page 123 and 124:
of computer technology to the payme
- Page 125 and 126:
trend by widening the sources and u
- Page 127 and 128:
changes. That is, members can arbit
- Page 129 and 130:
ceived to be a consequence of exces
- Page 131 and 132:
lowest point in the post-World War
- Page 133 and 134:
ing. Partly in response to the drop
- Page 135 and 136:
Chart 6-3Ratio of Consumer Installm
- Page 137 and 138:
Chart 6-4RATIO1.85Real Inventory/Sa
- Page 139 and 140:
percent increase in real defense pu
- Page 141 and 142:
8.8 percent in 1981. These declines
- Page 143 and 144:
housing. Borrowing by the nonfinanc
- Page 145 and 146:
orous competitor for credit as usur
- Page 147 and 148:
1982 their share had risen to over
- Page 149 and 150:
TABLE 6-9.—Economic outlook for 1
- Page 151:
A critical element in achieving hea
- Page 155 and 156:
LETTER OF TRANSMITTALCOUNCIL OF ECO
- Page 157 and 158:
Report to the President on the Acti
- Page 159 and 160:
ety of interagency and internationa
- Page 161:
ence J. Kotlikoff (Yale University)
- Page 165 and 166:
CONTENTSNATIONAL INCOME OR EXPENDIT
- Page 167 and 168:
B-70. Mortgage debt outstanding by
- Page 169 and 170:
NATIONAL INCOME OR EXPENDITURETABLE
- Page 171 and 172:
TABLE B-2.—Gross national product
- Page 173 and 174:
19291933193919401941194219431944194
- Page 175 and 176:
TABLE B-5.—Changes in GNP and GNP
- Page 177 and 178:
TABLE B-7.—Gross national product
- Page 179 and 180:
TABLE B-9.—Gross national product
- Page 181 and 182:
TABLE B-ll.—Gross national produc
- Page 183 and 184:
TABLE B-13.—Output, costs, and pr
- Page 185 and 186:
TABLE B-14.—Personal consumption
- Page 187 and 188:
TABLE B-16.—Gross and net private
- Page 189 and 190:
TABLE B-18.—Inventories and final
- Page 191 and 192:
TABLE B-20.—Relation of national
- Page 193 and 194:
TABLE B-21.—National income by ty
- Page 195 and 196:
TABLE B-22.—Sources of personal i
- Page 197 and 198:
TABLE B-24.—Total and per capita
- Page 199 and 200:
Year or quarterTotalTotalTABLE B-26
- Page 201 and 202:
POPULATION, EMPLOYMENT, WAGES, AND
- Page 203 and 204:
TABLE B-29.—Noninstitutional popu
- Page 205 and 206:
TABLE B-31.—Selected employment a
- Page 207 and 208:
TABLE B-33.—Civilian unemployment
- Page 209 and 210: TABLE B-35.—Unemployment by reaso
- Page 211 and 212: TABLE B-37.— Wage and salary work
- Page 213 and 214: TABLE B-39.—Average weekly earnin
- Page 215 and 216: TABLE B-41.—Changes in productivi
- Page 217 and 218: TABLE B-43-—Industrial production
- Page 219 and 220: TABLE B-45.—Capacity utilization
- Page 221 and 222: TABLE B-46.—New construction acti
- Page 223 and 224: TABLE B-48.—Nonfarm business expe
- Page 225 and 226: TABLE B-50.—Manufacturers' shipme
- Page 227 and 228: Year or monthAllitemsPRICESTABLE B-
- Page 229 and 230: TABLE B-53.—Consumer price indexe
- Page 231 and 232: TABLE B-55.—Changes in consumer p
- Page 233 and 234: TABLE B-57.—Producer price indexe
- Page 235 and 236: TABLE B-58.—Producer price indexe
- Page 237 and 238: TABLE B-59.—Producer price indexe
- Page 239 and 240: MONEY STOCK, CREDIT, AND FINANCETAB
- Page 241 and 242: TABLE B-63.—Commercial bank loans
- Page 243 and 244: TABLE B-64.—Total funds raised in
- Page 245 and 246: TABLE B-66.—Aggregate reserves of
- Page 247 and 248: TABLE B-67 .—Bond yields and inte
- Page 249 and 250: TABLE B-69.—Consumer installment
- Page 251 and 252: TABLE B-71-—Mortgage debt outstan
- Page 253 and 254: TABLE B-72.—Federal budget receip
- Page 255 and 256: TABLE B-74.—Relation of Federal G
- Page 257 and 258: TABLE B-76.—Federal Government re
- Page 259: TABLE B-78.—State and local gover
- Page 263 and 264: CORPORATE PROFITS AND FINANCETABLE
- Page 265 and 266: Year or quarterTABLE B-84.—Corpor
- Page 267 and 268: TABLE B-86.—Relation of profits a
- Page 269 and 270: TABLE B-88.—Determinants of busin
- Page 271 and 272: TABLE B-9Q.~Current assets and liab
- Page 273 and 274: TABLE B-92.—Common stock prices a
- Page 275 and 276: AGRICULTURETABLE B-94.—Farm incom
- Page 277 and 278: TABLE B-96.—Farm input use, selec
- Page 279 and 280: TABLE B-98.—U.S. exports and impo
- Page 281 and 282: INTERNATIONAL STATISTICSTABLE B-100
- Page 283 and 284: TABLE B-101.—U.S. international t
- Page 285 and 286: TABLE B-103.—U.S. merchandise exp
- Page 287 and 288: TABLE B-105.—International invest
- Page 289 and 290: TABLE B-107.— World trade balance
- Page 291 and 292: TABLE B-109.—Growth rates in real
- Page 293: TABLE B-lll.—Unemployment rate, a