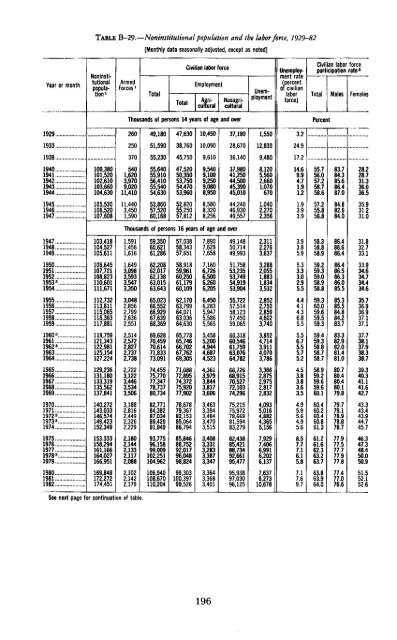
TABLE B-29-—Noninstitutional population and <strong>the</strong> labor force, 1929-82[Monthly data seasonally adjusted, except as noted]Year or monthNoninstitutionalpopulation»ArmedForces lTotalTotalCivilian labor forceEmploymentAgriculturalNonagriculturalUnemploymentment rate(percent<strong>of</strong> civilianlaborforce)Civilian labor forceparticipation rate 2Total Males FemalesThousands <strong>of</strong> persons 14 years <strong>of</strong> age and overPercent1929..26049,18047,63010,45037,1801,5503.21933..25051,59038,76010,09028,67012,83024.91939,.1940..1941..1942..1943..1944..100,380101,520102,610103,660104,6303705401,6203,9709,02011,41055,23055,64055,91056,41055,54054,63045,75047,52050,35053,75054,47053,9609,6109,5409,1009,2509,0808,95036,14037,98041,25044,50045,39045,0109,4808,1205,5602,6601,07067017.214.69.94.71.91.255.756.057.258.758.683.784.385.686.487.01945..1946..1947..105,530106,520107,60811,4403,4501,59053,86057,52060,16852,82055,25057,8128,5808,3208,25644,24046,93049,5571,0402,2702,3561.93.93.957.255.856.884.882.684.0Thousands <strong>of</strong> persons 16 years <strong>of</strong> age and over1947....1948....1949....103,418104,527105,6111,5911,4561,61659,35060,62161,28657,03858,34357,6517,8907,6297,65849,14850,71449,9932,3112,2763,6373.93.85.958.358.858.986.486.686.41950....1951....1952....19533..1954....106,645107,721108,823110,601111,6711,6493,0983,5933,5473,35062,20862,01762,13863,01563,64358,91859,96160,25061,17960,1097,1606,7266,5006,2606,20551,75853,23553,74954,91953,9043,2882,0551,8831,8343,5325.33.33.02.95.559.259.359.058.958.886.586.386.085.51955....1956....1957....1958....1959....112,732113,811115,065116,363117,8813,0482,8562,7992,6362,55165,02366,55266,92967,63968,36962,17063,79964,07163,03664,6306,4506,2835,9475,5865,56555,72257,51458,12357,45059,0652,8522,7502,8594,6023,7404.44.14.36.85.559.360.059.659.559.385.385.584.884.283.7I960 3196119628196319641965...1966...1967...1968...1969...119,759121,343122,981125,154127,224129,236131,180133,319135,562137,8412,5142,5722,8272,7372,7382,7223,1223,4463,5343,50669,62870,45970,61471,83373,09174,45575,77077,34778,73780,73465,77865,74666,70267,76269,30571,08872,89574,37275,92077,9025,4585,2004,9444,6874,5234,3613,9793,8443,8173,60660,31860,54661,75963,07664,78266,72668,91570,52772,10374,2963,8524,7143,9114,0703,7863,3662,8752,9752,8172,8325.56.75.55.75.24.53.83.83.63.559.459.358.858.758.758.959.259.659.660.183.382.982.081.481.080.780.480.480.179.81970197119723....1973 3 ....19741975197619771978 3 ....1979140,272143,033146,574149,423152,349153.333158,294161,166164,027166,9513,1882,8162 t4492,3262,2292,1802,1442,1332,1172,08882,77184,38287,03489,42991,94993,77596,15899,009102,251104,96278,67879,36782,15385,06486,79485,84688,75292,01796,04898,8243,4633,3943,4843,4703,5153,4083,3313,2833,3873,34775,21575,97278,66981,59483,27982,43885,42188,73492,66195,4774,0935,0164,8824,3655,1567,9297,4066,9916,2026,1374.95.95.64.95.68.57.77.16.15.860.460.260.460.861.361.261.662.363.263.779.779.178.978.878.777.977.577.777.977.81980..1981..1982..169,848172,272174,4512,1022,1422,179106,940108,670110,20499,303100,39799,5263,3643,3683,40195,93897,03096,1257,6378,27310,6787.17.69.763.863.964.077.477.076.6See next page for continuation <strong>of</strong> table.196
TABLE B-29.—Noninstitutional population and <strong>the</strong> labor force, 1929-82—Continued[Monthly data seasonally adjusted, except as noted]Year or monthNoninstitutionalpopulation1ArmedForces lTotalTotalCivilian labor forceEmploymentAgriculturalNonagriculturalUnemploymentUnemploymentrate(percent<strong>of</strong> civilianlaborforce)Civilian labor forceparticipation rate 2Total Males FemalesThousands <strong>of</strong> persons 16 years <strong>of</strong> age and overPercent1980:JanFebMarMay".'.".'.'"".".'.JuneJulyAugSeptOctNovDec1981:JanFebMarAprMayJuneJulyAugSeptOctNovDec1982:JanFebMarAprMayJuneMyAugSeptOctNovDec168,625168,846169,073169,289169,494169,735170,030170,217170,419170,624170,814171,007171,229171,400171,581171,770171,956172,172172,385172,559172,758172,966173,155173,330173,495173,657173,843174,020174,201174,364174,544174,707174,889175,069175,238175,3802,0812,0862,0902,0922,0882,0922,0992,1142,1212,1212,1192,1242,1252,1212,1282,1292,1272,1312,1392,1602,1652,1582,1582,1642,1592,1682,1752,1762,1752,1732,1802,1962,1982,1882,1802,182106,546106,637106,394106,552106,892106,832107,169107,116107,148107,438107,596107,446108,012108,175108,471108,866109,101108,440108,602108,762108,375109,028109,254109,066109,034109,364109,478109,740110,378110,147110,416110,614110,858110,752111,042111,12999,87299,96399,67799,20498,92298,76998,81698,82999,10499,32799,56799,65099,964100,143100,504101,006100,968100,393100,748100,709100,104100,355100,22999,67799,68899,69599,59799,48499,99499,68199,58899,68399,54399,17699,13699,0933,3133,3873,4123,3183,3853,3093,3313,2473,4483,3623,3873,4863,4203,3403,3563,5193,3713,3603,3203,3963,3583,3743,3893,2193,3793,3673,3673,3563,4463,3713,4453,4293,3633,4133,4663,41196,55996,57696,26595,88695,53795,46095,48595,58295,65695,96596,18096,16496,54496,80397,14897,48797,59797,03397,42897,31396,74696,98196,84096,45896,30996,32896,23096,12896,54896,31096,14396,25496,18095,76395,67095,6826,6746,6746,7177,3487,9708,0638,3538,2878,0448,1118,0297,7968,0488,0327,9677.8608,1338,0477,8548,0538,2718,6739,0259,3899,3469,6699,88110,25610,38410,46610,82810,93111,31511,57011,90612,0361 Not seasonally adjusted.2 Civilian labor force as percent <strong>of</strong> civilian noninstitutional population.3 Not strictly comparable with earlier data due to population adjustments as follows: Beginning 1953, introduction <strong>of</strong> 1950 censusdata added about 600,000 to population and about 350,000 to labor force, total employment, and agricultural employment. Beginning1960, inclusion <strong>of</strong> Alaska and Hawaii added about 500,000 to population, about 300,000 to labor force, and about 240,000 tononagricultural employment. Beginning 1962, introduction <strong>of</strong> 1960 census data reduced population by about 50,000 and labor force andemployment by about 200,000. Beginning 1972, introduction <strong>of</strong> 1970 census data added about 800,000 to civilian noninstitutionalpopulation ana about 333,000 to labor force and employment. A subsequent adjustment based on 1970 census in March 1973 added60,000 to labor force and to employment. Beginning 1978, changes in sampling and estimation procedures introduced into <strong>the</strong>household survey added about 250,000 to labor force and to employment. Unemployment levels and rates were not significantlyaffected.Note.—Labor force data in Tables B-29 through B-35 are based on household interviews and relate to <strong>the</strong> calendar week including<strong>the</strong> 12th Of <strong>the</strong> month. For definitions <strong>of</strong> terms, area samples used, historic comparability <strong>of</strong> <strong>the</strong> data, comparability with o<strong>the</strong>r series,etc., see "Employment and Earnings."Source: Department <strong>of</strong> Labor, Bureau <strong>of</strong> Labor Statistics.6.36.36.36.97.57.57.87.77.57.57.57.37.57.47.37.27.57.47.27.47.68.08.38.68.68.89.09.39.49.59.89.910.210.510.710.864.063.963.763.763.963.763.863.763.763.863.863.663.963.964.064.264.263.863.863.863.563.863.963.763.663.863.863.964.264.064.164.164.264.164.264.277.777.877.577.477.677.577.577.377.377.377.377.077.377.277.377.477.476.776.876.976.776.776.876.776.576.676.576.677.076.576.576.676.876.776.876.651.651.551.351.451.551.451.551.551.451.651.651.651.852.052.152.352.452152.152.151.752.252.352.052.152.352.352.452.752.752.952.952.852.752.853.0197
- Page 5:
CONTENTSPageECONOMIC REPORT OF THE
- Page 9 and 10:
ECONOMIC REPORT OF THE PRESIDENTTo
- Page 11 and 12:
Monetary policy will play a critica
- Page 13 and 14:
Interest Rates and the U.S. Trade D
- Page 15:
THE ANNUAL REPORTOF THECOUNCIL OF E
- Page 19 and 20:
CONTENTSPageCHAPTER 1. FROM RECESSI
- Page 21 and 22:
PageConclusions 122CHAPTER 6. REVIE
- Page 23 and 24:
CHAPTER 1From Recession to Recovery
- Page 25 and 26:
slowed somewhat in the 1970s regard
- Page 27 and 28:
nal GNP growth is reflected in a sl
- Page 29 and 30:
inflation. More specifically, the A
- Page 31 and 32:
inflation rate, or with a 12 percen
- Page 33 and 34:
1988, an increase of about one-four
- Page 35 and 36:
CHAPTER 2The Dual Problems of Struc
- Page 37 and 38:
frequently associated with poor hea
- Page 39 and 40:
Chart 2-2Distribution of Unemployme
- Page 41 and 42:
Chart 2-4Distribution of Unemployme
- Page 43 and 44:
These findings suggest several conc
- Page 45 and 46:
Wage RigidityA number of studies sh
- Page 47 and 48:
that these measures may have caused
- Page 49 and 50:
Most young people find jobs or leav
- Page 51 and 52:
to employers who hire youths. Tax c
- Page 53 and 54:
defined broadly to include individu
- Page 55 and 56:
ship between incomplete experience
- Page 57 and 58:
CHAPTER 3The United States in the W
- Page 59 and 60:
with 2.6 percent in the other Organ
- Page 61 and 62:
TABLE 3-1 .—Structure ofthe U.S.
- Page 63 and 64:
TABLE 3-2.—Trade balances by comm
- Page 65 and 66:
concentrate on doing what it does r
- Page 67 and 68:
the United States will depress pric
- Page 69 and 70:
Chart 3-3Real Exchange Rates Of Maj
- Page 71 and 72:
AN UNDERVALUED YEN?The explanations
- Page 73 and 74:
arily reduced the international com
- Page 75 and 76:
nancial markets. These transactions
- Page 77 and 78:
TABLE 3-6.—Economic performance b
- Page 79 and 80:
were undoubtedly a highly favorable
- Page 81 and 82:
of lenders that some debtors will n
- Page 83 and 84:
CHAPTER 4Increasing Capital Formati
- Page 85 and 86:
ate of net investment was required,
- Page 87 and 88:
able share in Japan and 56 percent
- Page 89 and 90:
During the 1970s, productivity grow
- Page 91 and 92:
MEASURING NATIONAL SAVINGDomestic s
- Page 93 and 94:
TAX RULES AND PERSONAL SAVINGMany e
- Page 95 and 96:
on consumption taxation might also
- Page 97 and 98:
Nevertheless, a number of economic
- Page 99 and 100:
tion permitted businesses to deprec
- Page 101 and 102:
A final problem under current tax l
- Page 103 and 104:
fleeted efforts to deal with proble
- Page 105 and 106:
egulation was probably not applicab
- Page 107 and 108:
Aeronautics Board, for example, the
- Page 109 and 110:
system resulted. Price controls, wh
- Page 111 and 112:
NGPA, both controlled and decontrol
- Page 113 and 114:
Price and allocation controls only
- Page 115 and 116:
nications industries through the re
- Page 117 and 118:
Several major pieces of legislation
- Page 119 and 120:
tempt to set cartel rates would be
- Page 121 and 122:
computer information and advertisin
- Page 123 and 124:
of computer technology to the payme
- Page 125 and 126:
trend by widening the sources and u
- Page 127 and 128:
changes. That is, members can arbit
- Page 129 and 130:
ceived to be a consequence of exces
- Page 131 and 132:
lowest point in the post-World War
- Page 133 and 134:
ing. Partly in response to the drop
- Page 135 and 136:
Chart 6-3Ratio of Consumer Installm
- Page 137 and 138:
Chart 6-4RATIO1.85Real Inventory/Sa
- Page 139 and 140:
percent increase in real defense pu
- Page 141 and 142:
8.8 percent in 1981. These declines
- Page 143 and 144:
housing. Borrowing by the nonfinanc
- Page 145 and 146:
orous competitor for credit as usur
- Page 147 and 148:
1982 their share had risen to over
- Page 149 and 150:
TABLE 6-9.—Economic outlook for 1
- Page 151: A critical element in achieving hea
- Page 155 and 156: LETTER OF TRANSMITTALCOUNCIL OF ECO
- Page 157 and 158: Report to the President on the Acti
- Page 159 and 160: ety of interagency and internationa
- Page 161: ence J. Kotlikoff (Yale University)
- Page 165 and 166: CONTENTSNATIONAL INCOME OR EXPENDIT
- Page 167 and 168: B-70. Mortgage debt outstanding by
- Page 169 and 170: NATIONAL INCOME OR EXPENDITURETABLE
- Page 171 and 172: TABLE B-2.—Gross national product
- Page 173 and 174: 19291933193919401941194219431944194
- Page 175 and 176: TABLE B-5.—Changes in GNP and GNP
- Page 177 and 178: TABLE B-7.—Gross national product
- Page 179 and 180: TABLE B-9.—Gross national product
- Page 181 and 182: TABLE B-ll.—Gross national produc
- Page 183 and 184: TABLE B-13.—Output, costs, and pr
- Page 185 and 186: TABLE B-14.—Personal consumption
- Page 187 and 188: TABLE B-16.—Gross and net private
- Page 189 and 190: TABLE B-18.—Inventories and final
- Page 191 and 192: TABLE B-20.—Relation of national
- Page 193 and 194: TABLE B-21.—National income by ty
- Page 195 and 196: TABLE B-22.—Sources of personal i
- Page 197 and 198: TABLE B-24.—Total and per capita
- Page 199 and 200: Year or quarterTotalTotalTABLE B-26
- Page 201: POPULATION, EMPLOYMENT, WAGES, AND
- Page 205 and 206: TABLE B-31.—Selected employment a
- Page 207 and 208: TABLE B-33.—Civilian unemployment
- Page 209 and 210: TABLE B-35.—Unemployment by reaso
- Page 211 and 212: TABLE B-37.— Wage and salary work
- Page 213 and 214: TABLE B-39.—Average weekly earnin
- Page 215 and 216: TABLE B-41.—Changes in productivi
- Page 217 and 218: TABLE B-43-—Industrial production
- Page 219 and 220: TABLE B-45.—Capacity utilization
- Page 221 and 222: TABLE B-46.—New construction acti
- Page 223 and 224: TABLE B-48.—Nonfarm business expe
- Page 225 and 226: TABLE B-50.—Manufacturers' shipme
- Page 227 and 228: Year or monthAllitemsPRICESTABLE B-
- Page 229 and 230: TABLE B-53.—Consumer price indexe
- Page 231 and 232: TABLE B-55.—Changes in consumer p
- Page 233 and 234: TABLE B-57.—Producer price indexe
- Page 235 and 236: TABLE B-58.—Producer price indexe
- Page 237 and 238: TABLE B-59.—Producer price indexe
- Page 239 and 240: MONEY STOCK, CREDIT, AND FINANCETAB
- Page 241 and 242: TABLE B-63.—Commercial bank loans
- Page 243 and 244: TABLE B-64.—Total funds raised in
- Page 245 and 246: TABLE B-66.—Aggregate reserves of
- Page 247 and 248: TABLE B-67 .—Bond yields and inte
- Page 249 and 250: TABLE B-69.—Consumer installment
- Page 251 and 252: TABLE B-71-—Mortgage debt outstan
- Page 253 and 254:
TABLE B-72.—Federal budget receip
- Page 255 and 256:
TABLE B-74.—Relation of Federal G
- Page 257 and 258:
TABLE B-76.—Federal Government re
- Page 259 and 260:
TABLE B-78.—State and local gover
- Page 261 and 262:
TABLE B-80.—Estimated ownership o
- Page 263 and 264:
CORPORATE PROFITS AND FINANCETABLE
- Page 265 and 266:
Year or quarterTABLE B-84.—Corpor
- Page 267 and 268:
TABLE B-86.—Relation of profits a
- Page 269 and 270:
TABLE B-88.—Determinants of busin
- Page 271 and 272:
TABLE B-9Q.~Current assets and liab
- Page 273 and 274:
TABLE B-92.—Common stock prices a
- Page 275 and 276:
AGRICULTURETABLE B-94.—Farm incom
- Page 277 and 278:
TABLE B-96.—Farm input use, selec
- Page 279 and 280:
TABLE B-98.—U.S. exports and impo
- Page 281 and 282:
INTERNATIONAL STATISTICSTABLE B-100
- Page 283 and 284:
TABLE B-101.—U.S. international t
- Page 285 and 286:
TABLE B-103.—U.S. merchandise exp
- Page 287 and 288:
TABLE B-105.—International invest
- Page 289 and 290:
TABLE B-107.— World trade balance
- Page 291 and 292:
TABLE B-109.—Growth rates in real
- Page 293:
TABLE B-lll.—Unemployment rate, a