

Economic Report of the President
Report - The American Presidency Project
Report - The American Presidency Project
- No tags were found...

Create successful ePaper yourself
Turn your PDF publications into a flip-book with our unique Google optimized e-Paper software.
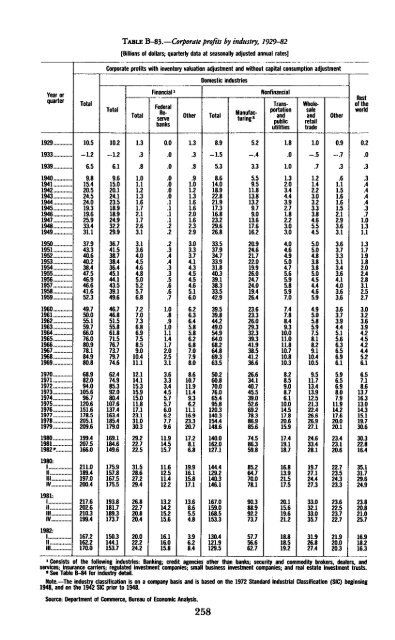
TABLE B-83.—Corporate pr<strong>of</strong>its by industry, 1929-82[Billions <strong>of</strong> dollars; quarterly data at seasonally adjusted annual rates]Corporate pr<strong>of</strong>its with inventory valuation adjustment and without capital consumption adjustmentDomestic industriesYear orquarterTotalTotalTotalFinancial >FederalReservebanksO<strong>the</strong>rTotalManufacturing2 5.2NonfinancialTransportationandpublicutilitiesWholesafeandretailtradeO<strong>the</strong>rnot.+Kesi<strong>of</strong> <strong>the</strong>world192919331939194019411942194319441945 ..19461947194819491950195119521953195419551956195719581959196019611962196319641965196619671968196919701971197219731974..19751976197719781979198019811982"1980:1II.HIIV1981:1||IllIV1982:|.||Ill10.5-1.26.59.815.420.524.524.019.319.625.933.431.137.943.340.640.238.447.546.946.641.652.349.750.055.159 766.076.080.978.184.980.868.982.094.0105.696.7120.6151.6178.5205.1209.6199.4207.5166.0211,0189.4197.0200.4217.6202.6210.3199.4167.2162.2170.010.2-1.26.19.615.020.124.123.518.918.924.932.229.936.741.538.738.436.445.144,143.539.149.646,746.851.555.861.871.576.773.779.774.662474.985 392.080.4107.6137.4163 4185.4179.0169.1184.6149.6175.9157.8167.5175.5193 8181.7189.3173.7150.3144.1153.71.3.3.81.01.11.21.31.61.72.11.72.63.13.13.64.04.54.64.85.05.25.76.87.27.07.3686.97.5859.010.411.112114.115315.915.011.817.123131.030.329.222.722.531.528.627.229.426 822.720 820.420.022.224.20.0.0.0.0.0.0.01111.2.2.2.3,4.4.3.3.5.6.6.71.0.8.9101.11.4172.02.53.1363.3344.55.75.76.0627.79.611.914.515.711.612.511.412.213 214.215 215.616.116.015.81.3.3.3.91.01.21.31.61.62.01.62.32.93.03.33.74.14.34.54.54.65,16.06.26.36.4585.86.2687.07.98.08610.711911.49.36.211.116 923.320.717.28.16.819.916.115.817.113 68.6554.83.96.28.48.9-1.55.38.614.018.922.821.917.316.823.229.626.833.537.934.733.931.840.339.138.333.542.939.539.844.249 054.964.068 264.869.363.550260.870076.065.495.8120.3140 3154.4148.6140.0162.0127.1144.4129.2140.3146.1167 0159.0168 5153.31 Consists <strong>of</strong> <strong>the</strong> following industries: Banking; credit agencies o<strong>the</strong>r than banks; security and commodity brokers, dealers, andservices; insurance carriers; regulated investment companies; small business investment companies; and real estate investment trusts.' See Table B-84 for industry detail.Note.—The industry classification is on a company basis and is based on <strong>the</strong> 1972 Standard Industrial Classification (SIC) beginning1948, and on <strong>the</strong> 1942 SIC prior to 1948.Source: Department <strong>of</strong> Commerce, Bureau <strong>of</strong> <strong>Economic</strong> Analysis,258130.4121,9129.5-.43.35.59.511.813.813.29.79.013.617.616.220.924.621.722.019926.024.724.019.426.423.623.326.029 332.339.341938.541.236.626634.140 745.539.052.669.278 386.985.674.586.359.885.264.770.078.190 388.992 273.757.756.662.71.8.01.01,32.03.44.43.92.71.82.23.03.04.04.64.95.047 5.65.95.85.97.07.47.88.49310.011.011810710.810.3828.5908.76.110.014.517 820.615.917.419.118716.813.921.517.520115.619621.218.818,519.21,0-.571.21.42.23.03.23.33.84.65.54.55.05.04.83.8385.04.54.44.65.94.95.05.859 7,58.1829.110.410.59511,713 413.912.521.322.426 626.927.124.633.428.119.727.124.427.333 032.133035731.926.827.40.9= 7.3.61.11.51.61.61.52.12.93.63.13.63.73.33.1343.64.14.03.63.63.63.73.9445.15.6636.56.96.1596.5698.07.911.914.217 620.020.123.423.120.622723.524.323.323622.523 722.721.920.020.30.2.0.3.3.4.4.4.4.371.01.31.11.3171.91.8202.42.83.12.5273.03.23.6394.24.5424.45.26.1657.18613.716.313.014,315119.730.630.322.816.435.131729.624.92382Q.B21025716.918.216.3


