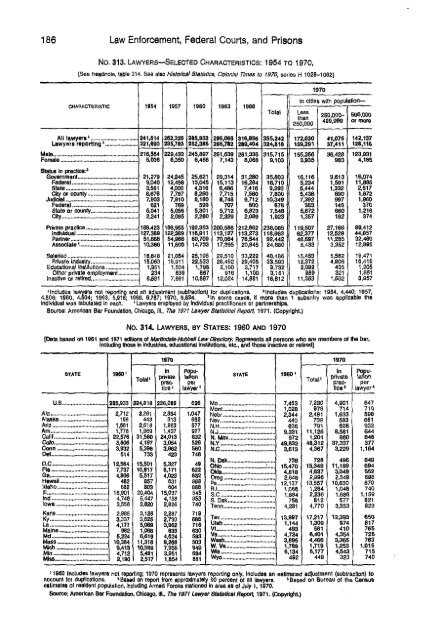
186 Law Enforcement, Federal Courts, and Prisons No, 313. L a w y e r s — S e l e c t e d C h a r a c t e r i s t i c s : 1954 t o 1970, [See headnote, table 314. See also H is to ric a l S ta tis tic s , C o lo n ia l T im e s to 1 9 7 0 , series H 1028-1062] CHARACTERISTIC 1954 1957 1960 1963 1966 Total 1970 In cities with population— Less than 250,000 250,000- 499,999 500,000 or more All lawyers*........................... 241,514 262,320 285,933 296,069 316,856 355,242 172,030 41,075 142,137 Lawyers reporting1................... 221,600 235,703 252,385 288,782 289,404 324,818 159,291 37,411 128,116 Male.................................................. 216.564 229,433 245.897 261,639 281.336 315,715 155,356 36,428 123,931 Female.............................................. 5,036 6,350 6,488 7,143 8,068 9,103 3,935 983 4.185 Status in practice:9 Government................................... 21,279 24,245 25,621 29,314 31,280 35,803 16,116 3,613 16,074 Federal... 9,040 12,458 13,045 15,113 16,284 18,710 5,234 1,591 11.885 State___ 3,561 4,000 4,316 6,486 7,416 9,293 5,444 1,332 2,517 City or county............................. 6,678 7,787 8,260 7,715 7,580 7,800 5,438 690 1,672 Judicial....... 7,903 7,910 0,180 8,748 9,712 10,349 7,392 997 1,960 Federal... 621 769 599 707 800 878 383 145 370 State or county 5,041 5,056 5,301 5,712 6,823 7,548 5,672 660 1,216 City.......... 2,241 2,085 2,280 2,329 2,089 1,923 1,357 192 374 Private practice.............................. 169,423 168,955 192,353 200,586 212.662 236,085 119,507 27,166 89,412 Individual.. 127.389 122,389 116,911 113,127 113,273 116,963 62.377 12,529 44,057 Partner.... 51,668 54,966 60,709 70,064 78,544 92.442 48,697 11,285 32,460 Associate4 10,366 11,600 14,733 17,395 20,845 24,680 8,433 3,362 12,865 Salaried...... 16,648 21,054 25,198 29,510 33,222 40,486 15,-153 5,562 19,471 Private industry............................ 15,063 18,911 22,533 26,492 29,405 33,593 12,372 4,806 16,415 Educational Institutions.................. 1,351 1,504 1,798 2,100 2,717 3,732 2,092 435 1,205 Other private employment.......... 234 639 867 918 1,100 3,161 989 321 1,851 inactive or retired........................... 6,581 7,661 10,887 12,024 14,881 16,812 11,353 1,502 3,957 ‘ Includes lawyers not reporting and an adjustment (subtraction) for duplications. “Includes duplications: 1954. 4,440; 1957, 4,506; 1960, 4,504; 1963, 5,018; 1966, 6,7u7; 197Q, 8,834. 3In some cases, If more than 1 subentry was applicable the individual was tabulated in each. ‘ Lawyers employed by individual practitioners or partnerships. Source: American Bar Foundation, Chicago, Hi., T h e 1971 L a w y e r S ta tis tic a l R e p o rt, 1971. (Copyright.) No. 3 1 4 . L a w y e r s , b y S t a t e s : i9 6 0 a n d 1 9 7 0 [Data based on 1961 and 1971 editions of M a rtin d a /e -H u b b e lt L a w D ire c to ry . Represents all persons who are members of the bar. including those in industries, educational institutions, etc., and those inactive or retired] 1970 1970 STATE I9601 Total' In private prao* tics3 Population per lawyer3 STATE I960' Total* In private practice3 Population per lawyer3 u .s ................................ 285,933 324,818 236,085 626 Ala................................. 2,712 3,291 2,334 1,047 Alaska............................ 198 443 313 682 Ariz................................... 1,681 2,618 1.963 877 Ark................................. 1,778 1,969 1,437 977 Calif............................... 22,576 31,580 24,013 632 Cofo 3,606 4,197 3,054 526 Conn 3,932 5,398 3.862 560 Del 514 733 423 748 D.C............................... 12,564 15,501 5,327 49 Fla........................................... 7,737 10,917 8,171 622 Ga............................................. 4,806 5.517 4,023 832 Hawaii......................... . 482 857 631 898 Idaho............................. 682 803 604 888 Ill.............................................. 18,901 20,404 15,037 545 Ind........................................... 4,746 5,447 4,158 953 Iowa............................. 3,556 3,820 2,626 740 Kane....................................... 2,985 3,126 2,287 719 Ky............................................ 3,337 3.625 2,730 886 La................................. 4,177 5,089 3,962 716 1,068 833 Md................................ 5,224 6,619 4,624 593 Mass............. ............... 10,384 11,316 9,268 503 Mteh.............................. 9,413 10,589 7,955 840 Min.............................. * 4.712 5,481 3,951 694 Miss.................. ............ 2,190 2,517 1,654 881 Mo................................. 7,453 7,230 4,901 647 Mont.............................. 1,026 978 714 710 Nebr.............................. 2,344 2,481 1,633 598 Nev 440 739 583 661 N.H 636 791 606 932 NU. 9.331 11,126 8,561 644 N. Mex 972 1,201 660 B46 N.Y 49.832 48.312 37,337 377 N.C 3,613 4,367 3.229 1,164 N. Dak 738 728 496 849 Ohio 15,470 15,349 11,199 694 Okla 4,818 4,637 3.049 552 Oreg.............................. 2,646 2,996 2,349 698 Pa................................. 12,137 13,557 10,630 870 R.l. 1,066 1,284 1,048 740 S.C 1,884 2,236 1,686 1,159 S. Dak........................... 758 612 577 821 Tenn.............................. 4,231 4,770 3,353 823 Tex............................... 13,997 17,217 12,393 650 Utah.............................. 1,144 1,309 974 817 Vt.. 493 581 410 765 Va. 4,724 6,401 4,354 726 Wash............................. 3,895 4,466 3,365 763 W. Va 1.789 1,719 1,253 1,015 Wis 6,134 6,177 4,543 715 Wyo 492 449 323 740 ‘1660 Includes lawyers not reporting; 1970 represents lawyers reporting only. Includes an estimated adjustment (subtraction) to account for duplications. “Based on report from approximately 90 percent ol alt lawyers. “Based on Bureau of the Census estimates of resident population, Including Armed Forces stationed in area as of July 1,1970. Source: American Bar Foundation, Chicago, ill., T h e 1971 Lawyer S ta tis tic a l R e p o rt, 1971. (Copyright.)
Courts 187 No. 315. U .S . S u p r e m e C o u r t — C a s e s F i le d a n d D i s p o s it io n : 1 9 7 0 t o 1 9 8 1 [Statutory term of court begins first Monday in October. See H is to ric a l S ta tis tic s , C o lo n ia l T im a s to 1970, series H 1063-1078, for related but not comparable data] ACTION 1970 1973 1974 1975 1976 1977 1978 1979 1980 1981 Total eases on docket.................... . 4,212 5,079 4,668 4,761 4,731 4,704 4,731 4,781 5,144 5,311 Appellate cases on docket... 1.903 2,480 2,308 2,352 2,324 2,341 2,383 2,509 2,749 2,935 From prior term.................. 325 412 540 431 452 472 434 425 527 522 Docketed during present tei m 1,578 2,068 1,768 1,921 1.872 1,869 1,949 2,084 2,222 2,413 Cases acted upon............. 1,613 1,948 1,967 1,900 2,019 1,979 2,023 2,050 ‘2,324 ■2,513 Granted review............... 214 229 235 244 237 224 210 199 167 203 Denied, dismissed, or withdrawn.............. 1,285 1,572 1,594 1,536 1,620 1,676 1,734 1,776 1,999 2,100 Summarily decided......... 114 147 138 118 162 79 79 75 90 114 Cases not acted upon___ _ 290 532 341 452 305 362 360 459 425 422 Pauper cases on docket....... 2,269 2,585 2,348 2,395 2,398 2,349 2,331 2,249 2,371 2,354 Cases acted upon............. 1,802 2,013 1,976 1,997 2,083 1,960 1,996 1,838 '2,027 '2,039 Granted review............... 41 30 28 28 30 24 27 32 17 7 Denied, dismissed, or withdrawn.............. 1,663 1,942 1,914 1,903 2,013 1,899 1,938 1,757 1,968 2,014 Summarily decided.................................. 78 41 34 66 40, 37 31 49 32 1 2 487 572 372 398 316 389 335 411 344 315 Original cases on docket................................ 20 14 12 14 8 14 17 23 24 2 2 Cases disposed of during term................... 7 4 4 7 2 3 - 1 7 6 Total cases available for argument................. 267 261 276 280 269 260 249 238 264 318 Cases disposed of...................................... 160 172 178 181 181 185 170 160 162 192 Cases argued.......................................... 151 170 175 179 176 172 168 156 154 184 Cases dismissed or remanded without argument............................................. 9 2 3 2 5 13 2 4 8 a Cases remaining......................................... 107 69 100 99 86 75 79 78 102 126 Cases decided by signed opinion................ 126 161 144 160 154 153 153 143 144 170 Cases decided by per curiam opinion.......... 22 8 20 18 22 8 8 12 8 10 Number of signed opinions......................... 109 140 123 138 126 129 130 130 123 141 - Represents zero. 'Includes cases granted review and carried over to next term, not shown separately. Source: Office of the Clerk, Supreme Court of the <strong>United</strong> <strong>States</strong>, unpublished data. No. 3 1 6 . U.S. Courts of A p p e a ls : i960 to 1981 [For years ending June 30. See also H is to ric a l S ta tis tic s , C o lo n ia l T im e s to 1 97 0, series H 1079-10961 ITEM I960 1965 1970 1974 1975 1976 1977 1978 1979 1980 1981 Cases commenced 1......................... 3,899 6,766 11,662 16,436 16,658 16,408 19,118 16,918 20,219 23,200 26.362 Criminal.......................................... 623 1,223 2,660 4,067 4,187 4,650 4.738 4,487 4,102 4.405 4.377 U.S. civil.................. 788 1,387 2,167 3,267 2,981 3,327 3,622 3,928 3,983 4,654 4.940 Private civil.............. 1,534 2,677 4,834 6,157 6,511 7,077 7,358 7,234 8,237 10,200 12,074 Administrative appeals.................... 737 1,106 1,522 2,205 2,290 2,515 2,564 2,382 2 ,9 2 2 2,950 3,800 Cases terminated ■.... 3,713 5,771 10,699 15,422 16,000 16,426 17,784 17,714 18,928 20,887 25,066 Criminal................... 580 1,014 2,581 4,299 4,005 4,238 4,554 4,461 4,320 3,993 4,192 U.S. civil.................. 750 1,229 1,912 2,791 3,094 2,653 3,198 3,437 3,857 4 ,3 4 6 5,021 Private civil.............. 1,517 2,183 4,367 5,847 6,252 6,248 6,680 6,813 7,175 6,942 11,327 Administrative appeals.................... 660 1,004 1,407 1,734 1,909 2 ,3 S 8 2,510 2,256 2,602 2,643 3,303 Cases disposed of I ......................... 2,681 3,546 6,139 8,461 9,077 9,351 11,400 8,850 9,285 10,607 12,168 Affirmed or granted......................... 1,924 2,635 4,626 6,429 6,763 6,995 7,826 6,717 7,062 8,017 9,004 Reversed or denied........................ 656 773 1,280 1,579 1,632 1,660 1,715 1,536 1,542 1,845 2 ,2 4 6 Other............................................. 101 138 233 443 6B2 676 1,859 597 681 745 918 Median monthss................................ 6.8 8.0 8.2 6.8 7.4 7.1 7.0 6.0 0.2 8.8 9.3 'Includes original proceedings and bankruptcy appeals not shown separately. ‘After hearing or submission. Beginning 1974, data not comparable with earlier years due to changes in criteria. 3 From filing of complete record to final disposition. No. 3 1 7 . U.S. D i s t r i c t C o u r t s — T r i a l s : 1960 t o 1981 ror years ending June 30. For I960, trials commenced; thereafter, trials completed. A trial is defined as a contested p ro c e e d in g (other than a nearing on a motion) before either court or jury in which evidence is introduced and linal Judgment sought. See footnote 1, table 319. See also H is to ric a l S ta tis tic s , C o lo n ia l lim e s to 1 97 0, series H 1112-1118] TYPE OP TRIAL 1960 1965 1970 1974 1975 1976 1977 1978 1979 1980 1981 Total............................. 9,998 11,485 16,032 16,572 19,236 19,580 18,827 18,851 18,563 19,82$ 21,239 CM Mats.,........................ 6,488 7,613 9,449 10,972 11,603 11,656 11,605 11,515 11,764 13,191 14,697 Nonjury......................... 3,453 4,459 6,078 7,403 7,903 8,098 7,792 8,326 8,346 9,254 10,047 Jury.............___ .........__ 3,035 3,154 3,371 3,569 3,700 3,556 3,813 3,189 3,416 3.93 7 4,650 Criminal trials................... 3.510 3,872 6,583 7,600 7,633 7,924 7,222 7,336 6,799 6,634 6,542 Nonjury........................ 1.008 1,143 2,357 2,753 2,726 2,773 2,661 3,3 4 4 3,132 3,216 2,962 Jury.............................. 2,502 2,729 4,226 4,847 4,907 5,151 4,561 3,992 3,667 3,418 3,580 Source of tables 316 and 317: Administrative Office of the U.S. Courts, Annual Report o f the Director:
- Page 1 and 2:
Statistical Abstract of the United
- Page 3 and 4:
Preface The S tatistical A b stract
- Page 5 and 6:
C o n ten ts [Numbers following sub
- Page 7 and 8:
Contents Sec. 11. SOCIAL INSURANCE
- Page 9 and 10:
Contents xi Page Sec. 22. TRANSPORT
- Page 11 and 12:
Contents xiii Page Sec. 33. COMPARA
- Page 13 and 14:
Guide to Tabular Presentation XV Th
- Page 15 and 16:
Recent Trends Population Rasident P
- Page 17 and 18:
Recent Trends XIX V ital Statistics
- Page 19 and 20:
Recent Trends xxi Labor Force and I
- Page 21 and 22:
Recent Trends xxiii Government, Def
- Page 23 and 24:
Recent Trends xxv Business and Fina
- Page 25 and 26:
Recent Trends xxvii Science, Commun
- Page 27:
1982 Election Results xxix th is sp
- Page 31 and 32:
xxxii 1982 Election Results T a b l
- Page 33 and 34:
X X X IV 1982 Election Results T a
- Page 35 and 36:
2 Population tional Population by A
- Page 37 and 38:
4 Population In the 1980 and 1981 C
- Page 39 and 40:
6 Population No. 1. P o p u l a t i
- Page 41 and 42:
8 Population No. 5. Population and
- Page 43 and 44:
10 Population No. 10. Resident Popu
- Page 45 and 46:
12 Population No. 1 1 . R e s id e
- Page 47 and 48:
14 Population No. 13. Interregional
- Page 49 and 50:
16 Population No. 19. M e t r o p o
- Page 51 and 52:
1 8 Population N o . 2 0 . L a r g
- Page 53 and 54:
20 Population No. 21. P o p u l a t
- Page 55 and 56:
2 2 Population NO: 26. Cities W ith
- Page 57 and 58:
2 4 Population No. 26. C i t i e s
- Page 60 and 61:
2 6 Population N o . 2 8 . P o p u
- Page 63 and 64:
28 Population No. 32. R e s id e n
- Page 65 and 66:
30 Population No. 33. R e s id e n
- Page 67 and 68:
32 Population No. 36. Resident Popu
- Page 69 and 70:
3 4 Population N o . 3 9 . P o p u
- Page 71 and 72:
36 Population No. 42. Population, b
- Page 73 and 74:
38 Population No. 46. C u r r e n t
- Page 75 and 76:
4 0 Population No. 50. E v e r - M
- Page 77 and 78:
4 2 Population No. 55. Interracial
- Page 79 and 80:
4 4 Population No. 61. Households,
- Page 81 and 82:
4 6 Population No. 65. H o u s e h
- Page 83 and 84:
4 8 Population N o . 6 8 . H o u s
- Page 85 and 86:
50 Population No. 7 1 . F a m ilie
- Page 87 and 88:
52 Population N o . 7 6 . C h il d
- Page 89 and 90:
54 Population No. 80. R eligious Bo
- Page 91 and 92:
56 Population No. 8 2 . R e li g io
- Page 93 and 94:
5 8 Vital Statistics Fertility and
- Page 95 and 96:
60 Vital Statistics No. 84. L iv e
- Page 97 and 98:
62 V ita l Statistics N o . S8. Liv
- Page 99 and 100:
64 Vital Statistics No. 9A. Social
- Page 101 and 102:
66 Vital Statistics No. 9 6 . P e r
- Page 103 and 104:
Vital Statistics NO. 100. CONTRACEP
- Page 105 and 106:
70 Vital Statistics No. 104. Legal
- Page 107 and 108:
72 Vital Statistics No. 107. E x p
- Page 109 and 110:
74 Vital Statistics No. 110. D e a
- Page 111 and 112:
76 Vital Statistics No. 113. Death
- Page 113 and 114:
78 Vital Statistics No. 115. Deaths
- Page 115 and 116:
80 Vital Statistics No. 119. Deaths
- Page 117 and 118:
8 2 Vital Statistics No. 124. M a r
- Page 119 and 120:
8 4 Vital Statistics No. 1 2 7 . D
- Page 121 and 122:
86 Immigration and Naturalization T
- Page 124 and 125:
88 Immigration and Naturalization N
- Page 126 and 127:
90 Immigration and Naturalization N
- Page 128 and 129:
92 Immigration and Naturalization N
- Page 130 and 131:
94 Immigration and Naturalization N
- Page 132 and 133:
96 Immigration and Naturalization N
- Page 134 and 135:
98 Health and Nutrition Figure 4.1
- Page 136 and 137:
100 Health and Nutrition Health res
- Page 138 and 139:
102 Health and Nutrition No. 1 5 1
- Page 140 and 141:
104 Health and Nutrition No. 154. G
- Page 142 and 143:
106 Health and Nutrition No. 1 6 0
- Page 144 and 145:
108 Health and Nutrition N O . 163.
- Page 146 and 147:
110 Health and Nutrition No. 168. V
- Page 148 and 149:
112 Health and Nutrition No. 173. H
- Page 150 and 151:
1 1 4 Health and Nutrition No. 176.
- Page 152 and 153:
116 Health and Nutrition No, 179. H
- Page 154 and 155:
1 1 8 Health and Nutrition No. 184.
- Page 156 and 157:
120 Health and Nutrition No. 187. P
- Page 158 and 159:
122 Health and Nutrition N o . 1 9
- Page 160 and 161:
1 2 4 Health and Nutrition No. 197.
- Page 162 and 163:
1 2 6 Health and Nutrition No. 201.
- Page 164 and 165:
128 Health and Nutrition No. 204. N
- Page 166 and 167:
130 Health and Nutrition No. 208. F
- Page 168 and 169:
132 Education Regular schools are t
- Page 170 and 171:
134 Education No. 211. P u b lic an
- Page 172 and 173: 136 Education N o . 2 1 4 . S c h o
- Page 174 and 175: 138 Education N o . 2 1 7 . E n r o
- Page 176 and 177: 140 Education I960, total1. 3 and 4
- Page 178 and 179: H 2 Education No. 223. Preprimary S
- Page 180 and 181: 144 Education No. 227. Y ears o f S
- Page 182 and 183: 1 4 6 Education No. 231. M e d ia n
- Page 184 and 185: 1 4 8 Education No. 235. Public Ele
- Page 186 and 187: 150 Education No. 240. Mode o f Tra
- Page 188 and 189: 152 Education No. 245. Pu b l ic El
- Page 190 and 191: 1 5 4 Education No. 2 4 9 . P u b l
- Page 192 and 193: 156 Education No. 252. P u b lic E
- Page 194 and 195: 158 Education No. 2 5 6 . H ig h S
- Page 196 and 197: 1 6 0 Education No. 2 8 1 . C o l l
- Page 198 and 199: 162 Education No. 265. College enro
- Page 200 and 201: 1 6 4 Education N o . 2 7 0 . INSTI
- Page 202 and 203: 166 Education No. 2 7 5 . I n s t i
- Page 204 and 205: 168 Education No. 2 7 9 . D e g r e
- Page 206 and 207: 170 Education No. 285. W o rk /T ra
- Page 208 and 209: 172 Law Enforcement, Federal Courts
- Page 210 and 211: 174 Law Enforcement, Federal Courts
- Page 212 and 213: 176 Law Enforcement, Federal Courts
- Page 214 and 215: 178 Law Enforcement, Federal Courts
- Page 216 and 217: 1 8 0 Law Enforcement, Federal Cour
- Page 218 and 219: 182 Law Enforcement, Federal Courts
- Page 220 and 221: 184 Law Enforcement, Federal Courts
- Page 224 and 225: 188 Law Enforcement, Federal Courts
- Page 226 and 227: 190 Law Enforcement, Federal Courts
- Page 228 and 229: 192 Law Enforcement, Federal Courts
- Page 230 and 231: 194 Law Enforcement, Federal Courts
- Page 232: Figure 7.1 Territorial Expansion of
- Page 235 and 236: 1 9 8 Geography and Environment Env
- Page 237 and 238: 2 0 0 Geography and Environment No.
- Page 239 and 240: 202 Geography and Environment N o .
- Page 241 and 242: 2 0 4 Geography and Environment No.
- Page 243 and 244: 206 Geography and Environment No. 3
- Page 245 and 246: 2 0 8 Geography and Environment No.
- Page 247 and 248: 210 Geography and Environment No. 3
- Page 249 and 250: 212 Geography and Environment No. 3
- Page 251 and 252: 2 1 4 Geography and Environment No.
- Page 253 and 254: 216 Geography and Environment N o.
- Page 255 and 256: 218 Geography and Environment No. 3
- Page 257 and 258: 220 Geography and Environment No. 3
- Page 260 and 261: 222 Geography and Environment No. 3
- Page 262 and 263: 224 Public Lands, Parks, Recreation
- Page 264 and 265: 226 Public Lands, Recreation and Tr
- Page 266 and 267: 228 Public Lands, Parks, Recreation
- Page 268 and 269: 230 Public Lands, Parks, Recreation
- Page 270 and 271: 232 Public Lands, Parks, Recreation
- Page 272 and 273:
234 Public Lands, Parks, Recreation
- Page 274 and 275:
2 3 6 Public Lands, Parks, Recreati
- Page 276 and 277:
2 3 8 Public Lands, Parks, Recreati
- Page 278 and 279:
2 4 0 Public Lands, Parks, Recreati
- Page 280:
Figure 9.1 The Government of the Un
- Page 283 and 284:
244 Federal Government Finances and
- Page 285 and 286:
246 Federal Government Finances and
- Page 287 and 288:
248 Federal Government Finances and
- Page 289 and 290:
250 Federal Government Finances and
- Page 291 and 292:
252 Federal Government Finances and
- Page 293 and 294:
2 5 4 Federal Government Finances a
- Page 295 and 296:
256 Federal Government Finances and
- Page 297:
N o . 437. F e d e r a l I n d i v
- Page 300 and 301:
2 6 0 Federal Government Finances a
- Page 302 and 303:
262 Federal Government Finances and
- Page 304 and 305:
2 6 4 Federal Government Finances a
- Page 306 and 307:
266 Federal Government Finances and
- Page 308 and 309:
268 Federal Government Finances and
- Page 310 and 311:
270 State and Local Government Fina
- Page 312 and 313:
272 State and Local Government Fina
- Page 314 and 315:
274 State and Local Government Fina
- Page 316 and 317:
276 State and Local Government Fina
- Page 318 and 319:
278 State and Local Government Fina
- Page 320 and 321:
280 State and Local Government Fina
- Page 322 and 323:
2 8 2 State and Local Government Fi
- Page 324 and 325:
2 8 4 State and Local Government Fi
- Page 326 and 327:
286 State and Local Government Fina
- Page 328 and 329:
288 State and Local Government Fina
- Page 330 and 331:
2 9 0 State and Local Government Fi
- Page 332 and 333:
292 State and Local Government Fina
- Page 334 and 335:
294 State and Local Government Fina
- Page 336 and 337:
2 9 6 State and Local Government Fi
- Page 338 and 339:
2 9 8 State and Local Government Fi
- Page 340 and 341:
300 State and Local Government Fina
- Page 342 and 343:
3 0 2 State and Local Government Fi
- Page 344 and 345:
304 State and Local Government Fina
- Page 346 and 347:
306 State and Local Government Fina
- Page 348 and 349:
308 State and Local Government Fina
- Page 350 and 351:
3 1 0 State and Local Government Fi
- Page 352 and 353:
312 Social Insurance and Human Serv
- Page 354 and 355:
314 Social Insurance and Human Serv
- Page 356 and 357:
316 Social Insurance and Human Serv
- Page 358 and 359:
316 Social Insurance and Human Serv
- Page 360 and 361:
320 Social Insurance and Human Serv
- Page 362 and 363:
322 Social Insurance and Human Serv
- Page 364 and 365:
3 2 4 Social Insurance and Human Se
- Page 366 and 367:
326 Social Insurance and Human Serv
- Page 368 and 369:
328 Social Insurance and Human Serv
- Page 370 and 371:
330 Social Insurance and Human Serv
- Page 372 and 373:
332 Social Insurance and Human Serv
- Page 374 and 375:
334 Social Insurance and Human Serv
- Page 376 and 377:
336 Social Insurance and Human Serv
- Page 378 and 379:
338 Social Insurance and Human Serv
- Page 380 and 381:
340 Social Insurance and Human Serv
- Page 382 and 383:
342 Social Insurance and Human Serv
- Page 384 and 385:
344 Social Insurance and Human Serv
- Page 386 and 387:
346 Social In s u r a n c e a n d H
- Page 388 and 389:
348 National Defense and Veterans A
- Page 390 and 391:
350 National Defense and Veterans A
- Page 392 and 393:
352 National Defense and Veterans A
- Page 394 and 395:
354 National Defense and Veterans A
- Page 396 and 397:
356 National Defense and Veterans A
- Page 398 and 399:
3 5 8 National Defense and Veterans
- Page 400 and 401:
360 National Defense and Veterans A
- Page 402 and 403:
362 National Defense and Veterans A
- Page 404 and 405:
364 National Defense and Veterans A
- Page 406 and 407:
366 National Defense and Veterans A
- Page 408 and 409:
368 National Defense and Veterans A
- Page 410 and 411:
3 7 0 National Defense and Veteran
- Page 412 and 413:
372 Labor Force, Employment, and Ea
- Page 414:
F ig u re 13.2 Trends in the Labor
- Page 417 and 418:
376 Labor Force, Employment, and Ea
- Page 419 and 420:
378 Labor Force, Employment, and Ea
- Page 421 and 422:
380 Labor Force, Employment, and Ea
- Page 423 and 424:
382 Labor Force, Employment, and Ea
- Page 425 and 426:
3 8 4 Labor Force, Employment, and
- Page 427 and 428:
386 Labor Force, Employment, and Ea
- Page 429 and 430:
3 8 8 Labor Force, Employment, and
- Page 431 and 432:
390 Labor Force, Employment, and Ea
- Page 433 and 434:
392 Labor Force, Employment, and Ea
- Page 435 and 436:
394 Labor Force, Employment, and Ea
- Page 437 and 438:
3 9 6 Labor Force, Employment, and
- Page 439 and 440:
398 Labor Force, Employment, and Ea
- Page 441 and 442:
400 Labor Force, Employment, and Ea
- Page 443 and 444:
402 Labor Force, Employment, and Ea
- Page 445 and 446:
4 0 4 Labor Force, Employment, and
- Page 447 and 448:
406 Labor Force, Employment, and Ea
- Page 449 and 450:
408 Labor Force, Employment, and Ea
- Page 451 and 452:
410 Labor Force, Employment, and Ea
- Page 453 and 454:
4 1 2 Labor Force, Employment, and
- Page 455 and 456:
4 1 4 Income, Expenditures, and Wea
- Page 457 and 458:
416 Income, Expenditures, and Wealt
- Page 459 and 460:
418 Income, Expenditures, and Wealt
- Page 461 and 462:
420 Income, Expenditures, and Wealt
- Page 463 and 464:
422 Income, Expenditures, and Wealt
- Page 465 and 466:
424 Income, Expenditures, and Wealt
- Page 467 and 468:
426 Income, Expenditures, and Wealt
- Page 469 and 470:
428 Income, Expenditures, and Wealt
- Page 471 and 472:
430 Income, Expenditures, and Wealt
- Page 473 and 474:
432 Income, Expenditures, and Wealt
- Page 475 and 476:
434 Income, Expenditures, and Wealt
- Page 477 and 478:
436 Income, Expenditures, and Wealt
- Page 479 and 480:
438 Income, Expenditures, and Wealt
- Page 481 and 482:
440 Income, Expenditures, and Wealt
- Page 483 and 484:
442 Income, Expenditures, and Wealt
- Page 485 and 486:
444 Income, Expenditures, and Wealt
- Page 487 and 488:
Families Below Poverty Level 4 4 5
- Page 489 and 490:
Persons Below Poverty Level—Appal
- Page 491 and 492:
Personal Wealth 449 No. 742. P e r
- Page 493 and 494:
Section 15 Prices This section pres
- Page 495 and 496:
Price Indexes—Labor Costs, Federa
- Page 497 and 498:
Producer Price Indexes 455 No. 749.
- Page 499 and 500:
Producer Price Indexes— Spot Mark
- Page 501 and 502:
Export and Import Prices 459 No. 7
- Page 503 and 504:
Consumer Price Indexes 461 N o . 7
- Page 505 and 506:
Consumer Prices 4 6 3 No. 760. A n
- Page 507 and 508:
Budget Costs 465 No. 763. U r b a n
- Page 509 and 510:
Urban Budget 467 No. 765. Annual Bu
- Page 511 and 512:
Rent and Utility Prices 469 No. 770
- Page 513 and 514:
Section 16 Elections This section r
- Page 515 and 516:
Elections 473 Figure 16.1 Popular V
- Page 517 and 518:
Popular Vote Cast for President 475
- Page 519 and 520:
Votes Cast For President 477 No. 78
- Page 521 and 522:
Vote Cast for United States Senator
- Page 523 and 524:
Vote Cast for U.S. Representative 4
- Page 525 and 526:
Composition of Congress—Congressi
- Page 527 and 528:
Members of Congress 485 No. 792. Me
- Page 529 and 530:
Composition of State Legislatures 4
- Page 531 and 532:
Women Holding Public Office—Voter
- Page 533 and 534:
Voter Registration and Persons Voti
- Page 535 and 536:
Voter Participation 493 No. 806. P
- Page 537 and 538:
Congressional Campaign Finances—C
- Page 539 and 540:
S ection 17 Banking, Finance, and I
- Page 541 and 542:
Flow of Funds 499 No. 812. F l o w
- Page 543 and 544:
Flow of Funds 501 No. 815. F l o w
- Page 545 and 546:
Federal Reserve Banks 503 No. 819.
- Page 547 and 548:
Commercial Banks 505 N o . 8 2 6 .
- Page 549 and 550:
Commercial Banks—Foreign Banks 50
- Page 551 and 552:
Savings and Loan Associations 509 N
- Page 553 and 554:
Foreign Lending—Loans 511 No. 840
- Page 555 and 556:
Consumer Credit—Finance Rates 513
- Page 557 and 558:
Money Stock— Deposits and Interes
- Page 559 and 560:
Yields and Rates— Stocks and Opti
- Page 561 and 562:
Securities—Stock Ownership—Comm
- Page 563 and 564:
Life Insurance 521 N o. 8 64. Lif e
- Page 565 and 566:
Health Insurance—Property Insuran
- Page 567 and 568:
Section 18 Business Enterprise This
- Page 569 and 570:
Business Enterprise 527 Figure 18.1
- Page 571 and 572:
Proprietorships, Partnerships, and
- Page 573 and 574:
M ergers and Acquisitions 531 No. 8
- Page 575 and 576:
Industrial Failures—Bankruptcy Ca
- Page 577 and 578:
Corporations 535 N o. 894. N o n f
- Page 579 and 580:
Corporation Income Tax Returns—Ca
- Page 581 and 582:
Business Capital 539 N o . 9 0 4 .
- Page 583 and 584:
Economic Indicators 541 N o . 9 0 9
- Page 585 and 586:
Corporations 5 4 3 No. 913. Manufac
- Page 587 and 588:
Corporate Profits 545 N o . 9 1 7 .
- Page 589 and 590:
Capital Expenditures— Foreign-Own
- Page 591 and 592:
Royalties and Fees— Corporate Phi
- Page 593 and 594:
Section 19 Communications This sect
- Page 595 and 596:
Postal Revenues—Postal Employees
- Page 597 and 598:
Media Utilization—Telephone and T
- Page 599 and 600:
Telephones 557 No. 939. T e l e p h
- Page 601 and 602:
Stations Authorized—Public TV Sta
- Page 603 and 604:
Radios and TV Sets—Publishing Ind
- Page 605 and 606:
Newspapers—Copyright Registration
- Page 607 and 608:
Books Sold—Imports and Translatio
- Page 609 and 610:
T elevision Advertising E xpenditur
- Page 611 and 612:
S e c t i o n 2 0 E n e rg y This s
- Page 613 and 614:
Horsepower—Fuel Resources 571 No.
- Page 615 and 616:
Fossil Fuel Prices—Energy Consump
- Page 617 and 618:
Residential Energy Consumption and
- Page 619 and 620:
World Energy—Crude Oil Flow 577 N
- Page 621 and 622:
Crude Oil— Energy Producing Compa
- Page 623 and 624:
Electric Energy 581 N o . 9 9 2 . E
- Page 625 and 626:
Electric Energy 583 No. 995. El e c
- Page 627 and 628:
Electric Utilities—Public Utiliti
- Page 629 and 630:
Gas Utility Industry 587 No. 1 0 0
- Page 631 and 632:
Nuclear Power—Uranium 589 NO. 100
- Page 633 and 634:
This section presents statistics on
- Page 635 and 636:
Research and Development 593 N o .
- Page 637 and 638:
Research and Development Funds 5 9
- Page 639 and 640:
Scientists and Engineers 597 NO, 10
- Page 641 and 642:
Graduate Students—Degrees Conferr
- Page 643 and 644:
Space Program 601 No. 1035. Nationa
- Page 645 and 646:
Section 22 Transportation--* Land T
- Page 647 and 648:
Transportation Outlays 605 No. 1039
- Page 649 and 650:
Freight and Passenger Volume 6 0 7
- Page 651 and 652:
Highway Mileage 609 No. 1048. H i g
- Page 653 and 654:
Receipts and Disbursements 6 1 1 N
- Page 655 and 656:
Motor Vehicle Summary 613 No. 1058.
- Page 657 and 658:
Motor Vehicles—Accidents 615 No.
- Page 659 and 660:
Automobile Output—Cars and Trucks
- Page 661 and 662:
Recreational Vehicle—Travel—Fue
- Page 663 and 664:
Gasoline Prices—Motor Vehicle Tra
- Page 665 and 666:
Passenger Transit industry—Mass T
- Page 667 and 668:
Intercity Bus Lines—Trucks—Rail
- Page 669 and 670:
Railroads 627 No. 1089. R a il r o
- Page 671 and 672:
Railroad Accidents—Petroleum and
- Page 673 and 674:
Section 23 T ran sp o rtatio n - Ai
- Page 675 and 676:
Air Carriers 633 N o . 1 0 9 9 . C
- Page 677 and 678:
Civil Flying 635 No. 1102. C i v i
- Page 679 and 680:
Aerospace and Aircraft Industries
- Page 681 and 682:
Commerce—Corps of Engineers Expen
- Page 683 and 684:
Waterborne Commerce—Containerized
- Page 685 and 686:
Merchant Vessels—Shipyards 643 No
- Page 687 and 688:
Merchant Vessels 6 4 5 N o. 1132. M
- Page 689 and 690:
S e c tio n 2 4 Agriculture This se
- Page 691 and 692:
Agriculture 649 Livestock.—Annual
- Page 693 and 694:
Farm Population and Families 651 N
- Page 695 and 696:
Farms—Corporate Farms 653 No. 114
- Page 697 and 698:
Farms 655 N o . 1 1 4 8 . F a r m s
- Page 699 and 700:
Farms—Farm Debt Status—Irrigati
- Page 701 and 702:
Farm Land— Foreign Ownership—Se
- Page 703 and 704:
Farm Sector Balance Sheet—Gross F
- Page 705 and 706:
Farm Income and Expenses 663 No. 11
- Page 707 and 708:
Farm Marketings 665 No. 1170. Farm
- Page 709 and 710:
Price Indexes—Farm Income 667 No.
- Page 711 and 712:
Commodity Credit Corporation— Far
- Page 713 and 714:
Civilian Consumer Expenditures For
- Page 715 and 716:
Farm Indexes—Machinery and Equipm
- Page 717 and 718:
Farm Output Indexes—Farm Labor 67
- Page 719 and 720:
Food For Peace Sales and Donations
- Page 721 and 722:
Crops 679 No. 1200. P r i n c i p a
- Page 723 and 724:
Corn 6 8 1 N o . 1 2 0 3 . C o r n
- Page 725 and 726:
Soybeans—Sorghum Grain 6 8 3 N o.
- Page 727 and 728:
Cotton—Tobacco 685 No. 1213. C o
- Page 729 and 730:
Sugarcane-Fruits—'Vegetables 687
- Page 731 and 732:
Livestock—Meats 689 No. 1224. Liv
- Page 733 and 734:
Dairying 691 No. 1228. D a iry in g
- Page 735 and 736:
Section 25 F o res ts a n d F o re
- Page 737 and 738:
Forest Land— Ownership, Sawtimber
- Page 739 and 740:
Forest Trees— Timber Products 697
- Page 741 and 742:
Lumber Production and Consumption 6
- Page 743 and 744:
Pulpwood—Paper—Newsprint 701 No
- Page 745 and 746:
703 i , g u ■ Section 26 F is h e
- Page 747 and 748:
Fishery Products—Fisheries 7 0 5
- Page 749 and 750:
Catch and Value— Products 707 N o
- Page 751 and 752:
Quantity and Value of Catch 709 N o
- Page 753 and 754:
Fishery Products—Imports and Expo
- Page 755 and 756:
Section 27 Mining and Mineral Produ
- Page 757 and 758:
Mineral Production— Value— Pric
- Page 760 and 761:
Mineral Industries 717 N o . 1280.
- Page 762 and 763:
Mineral Production—Value 719 No.
- Page 764 and 765:
Mineral Production and Value 721 a
- Page 766 and 767:
Mineral Imports and Exports 723 No.
- Page 768 and 769:
World Production—Consumption 725
- Page 770 and 771:
Petroleum— Gas 727 N o . 1296. C
- Page 772 and 773:
Oil and Gas Reserves—Direct Inves
- Page 774 and 775:
Natural Gas Liquids— Coal and Cok
- Page 776 and 777:
Potash— Sulfur— Lead 733 N o .
- Page 778 and 779:
Copper— Molybdenum—Cobalt 735 N
- Page 780 and 781:
Zinc—Bauxite—Aluminum 737 N o .
- Page 782 and 783:
Section 28 Construction and Housing
- Page 784 and 785:
Construction and Housing 741 Figure
- Page 786 and 787:
Value of New Construction 743 No. 1
- Page 788 and 789:
Construction Contracts 745 No. 1335
- Page 790 and 791:
New Housing Units Started—Mobile
- Page 792 and 793:
New and Existing Houses Sold-Mobile
- Page 794 and 795:
Housing Units Summary 751 No. 1349.
- Page 796 and 797:
Occupied Housing Units—Financial
- Page 798 and 799:
Housing Units 7 5 5 S e le c te d C
- Page 800 and 801:
Occupied Housing Units 757 No. 1367
- Page 802 and 803:
Appliances—Heating Fuel and Equip
- Page 804 and 805:
Vacancy Rates—Residential Propert
- Page 806 and 807:
Mortgage Loans 763 No. 1370. Charac
- Page 808 and 809:
S e c t i o n 2 9 Manufactures This
- Page 810 and 811:
Manufactures 7 6 7 Figure 29.1 Manu
- Page 812 and 813:
Industrial Production Indexes—Cap
- Page 814 and 815:
Manufactures, by States 771 BY STAT
- Page 816 and 817:
Industry Groups 773 F o r I n d u s
- Page 818 and 819:
Industry Groups 775 for Industry Gr
- Page 820 and 821:
Industry Groups 777 f o r In d u s
- Page 822 and 823:
Manufacturing Establishments—Empl
- Page 824 and 825:
Manufactures Exports 781 No. 1393.
- Page 826 and 827:
Energy— Value Added Shares 7 8 3
- Page 828 and 829:
Beverage Industry 7 8 5 No. 1401. B
- Page 830 and 831:
Wool—Cotton—Broadwoven Fabrics
- Page 832 and 833:
Chemicals 789 No. 1413. C hem icals
- Page 834 and 835:
Iron and Steel— Pig Iron and Ferr
- Page 836 and 837:
Mill Products—Machine Tools—Hea
- Page 838 and 839:
Electronic Computing Equipment—El
- Page 840 and 841:
Home Appliances 797 No. 1434. H o m
- Page 842 and 843:
Section 30 Domestic Trade and Servi
- Page 844 and 845:
Employment-Retail Trade 8 0 1 No. 1
- Page 846 and 847:
Retail Trade— Department Stores 8
- Page 848 and 849:
Gasoline Service Stations—Group F
- Page 850 and 851:
Retail Trade by Kind of Business 80
- Page 852 and 853:
Franchising 809 No. 1451. F r a n c
- Page 854 and 855:
Wholesale Trade 8 1 1 No. 1456. W h
- Page 856 and 857:
Selected Services— Hotels and Mot
- Page 858 and 859:
Selected Service Industries 815 N o
- Page 860 and 861:
Section 31 Foreign Comm erce and Ai
- Page 862 and 863:
Foreign Commerce and Aid 819 Import
- Page 865:
U .S . p riv a te a s s e ts , n e
- Page 868 and 869:
International Investment Position
- Page 870 and 871:
Foreign Investors 825 No. 1473. U.S
- Page 873 and 874:
Foreign Grants and Credits 827 No.
- Page 875 and 876:
Foreign Grants and Credits 829 N o
- Page 877 and 878:
Economic and Military Aid 831 N o.
- Page 879 and 880:
Exports and Imports 833 No. 1482. U
- Page 881 and 882:
Exports and Imports 835 No. 1487. D
- Page 884 and 885:
Other Western Hemisphere...........
- Page 886:
CONTINENT. AREA, AND COUNTRY C o m
- Page 890 and 891:
8 4 0 Foreign Commerce and Aid No.
- Page 892 and 893:
8 4 2 Foreign Commerce and Aid N o
- Page 894 and 895:
8 4 4 Foreign Commerce and Aid N o
- Page 896 and 897:
846 Outlying Areas No. 1495. E s t
- Page 898 and 899:
848 Outlying Areas No. 1300. V ita
- Page 900 and 901:
850 Outlying Areas No. 1504. Pu e r
- Page 902 and 903:
852 Outlying Areas No. 1509. Pu e r
- Page 904 and 905:
854 Comparative International Stati
- Page 906 and 907:
856- Comparative International Stat
- Page 908 and 909:
8 5 8 Comparative International Sta
- Page 910 and 911:
860 Comparative International Stati
- Page 912 and 913:
862 Comparative International Stati
- Page 914 and 915:
8 6 4 Comparative International Sta
- Page 916:
No. 1 5 2 5 . G r o s s d o m e s t
- Page 920 and 921:
868 Comparative International Stati
- Page 922 and 923:
870 Comparative International Stati
- Page 924 and 925:
872 Comparative International Stati
- Page 926 and 927:
8 7 4 Comparative International Sta
- Page 928 and 929:
8 7 6 Comparative International Sta
- Page 930 and 931:
8 7 8 Comparative International Sta
- Page 932 and 933:
880 Comparative International Stati
- Page 934 and 935:
8 8 2 Comparative International Sta
- Page 936 and 937:
884 Comparative International Stati
- Page 938 and 939:
886 Comparative International Stati
- Page 940 and 941:
886 Comparative International Stati
- Page 942 and 943:
890 Comparative International Stati
- Page 944 and 945:
Appendix I Historical Series—'Ind
- Page 946:
894 Appendix II
- Page 949 and 950:
896 Appendix II Effect of changes I
- Page 951 and 952:
APPENDIX II Standard Metropolitan S
- Page 953 and 954:
900 Appendix II Gadsden, Ala......
- Page 955 and 956:
902 Appendix II 1 9 8 0 P o p u
- Page 957 and 958:
9 0 4 Appendix II NEW ENGLAND COUNT
- Page 959 and 960:
906 Appendix III The particular sam
- Page 961 and 962:
908 Appendix ill S U B J E C T , S
- Page 963 and 964:
910 Appendix III S U B J E C T , S
- Page 965 and 966:
9 1 2 Appendix III SUBJECT, SOURCE,
- Page 967 and 968:
9 1 4 Appendix III SUBJECT, SOURCE,
- Page 969 and 970:
916 Appendix III SUBJECT, SOURCE, T
- Page 971 and 972:
918 Appendix III SUBJECT, SOURCE, T
- Page 973 and 974:
920 Appendix III SUBJECT, SOURCE, T
- Page 975 and 976:
922 Appendix III SUBJECT, SOURCE, T
- Page 977 and 978:
APPENDIX IV Guide to Sources of Sta
- Page 979 and 980:
926 Appendix IV Agriculture—Con.
- Page 981 and 982:
928 Appendix IV Commodity Prices—
- Page 983 and 984:
930 Appendix IV Construction, Housi
- Page 985 and 986:
932 Appendix IV Education—Con. U.
- Page 987 and 988:
934 Appendix IV Energy— Con. U S
- Page 989 and 990:
936 Appendix IV Federal Government
- Page 991 and 992:
938 Appendix IV Foreign Commerce—
- Page 993 and 994:
940 Appendix IV Health and Medical
- Page 995 and 996:
942 Appendix IV International Stati
- Page 997 and 998:
944 Appendix IV Investments and Sec
- Page 999 and 1000:
946 Appendix IV Labor—Con. U.S. G
- Page 1001 and 1002:
948 Appendix IV Manufactures—Con.
- Page 1003 and 1004:
950 Appendix IV Money and Banking
- Page 1005 and 1006:
952 Appendix IV Newspapers, Periodi
- Page 1007 and 1008:
954 Appendix IV Research and Develo
- Page 1009 and 1010:
9 5 6 Appendix IV Social Insurance
- Page 1011 and 1012:
958 Appendix IV Social Insurance an
- Page 1013 and 1014:
960 Appendix IV Transportation—Co
- Page 1015 and 1016:
962 Appendix IV Vocational Rehabili
- Page 1017 and 1018:
964 Appendix IV Illinois—Con. Dep
- Page 1019 and 1020:
966 W est Virginia—Con, Appendix
- Page 1021 and 1022:
968 Appendix V Index to State Stati
- Page 1023 and 1024:
970 Index A lu-B ak Page Aluminum a
- Page 1025 and 1026:
972 Index Bon-Cem Bonds—Continued
- Page 1027 and 1028:
9 7 4 Index Goa-Con Coal—Continue
- Page 1029 and 1030:
976 Index Dai-Eat D a iry pro d u c
- Page 1031 and 1032:
878 In d ex Ele-Em p E le c tric li
- Page 1033 and 1034:
980 Index Far-Fin F a rm e rs a n d
- Page 1035 and 1036:
982 Index For-Fue P a g e P a g e F
- Page 1037 and 1038:
984 Index Gov-Hea Page Government
- Page 1039 and 1040:
9 8 6 I n d e x Hou-lnc Households
- Page 1041 and 1042:
988 I n d e x Ira-Lib Iron—Contin
- Page 1043 and 1044:
990 I n d e x Man-Men Page Manufact
- Page 1045 and 1046:
992 Index Min-Nat Page Minority rac
- Page 1047 and 1048:
9 9 4 Index Oil-Pas Page Oils—Con
- Page 1049 and 1050:
996 Index Phy-Pot Page Physlclans
- Page 1051 and 1052:
9 9 8 Index Psy-Rec Page Psychology
- Page 1053 and 1054:
1000 Index S t-S e r S t. L u c ia
- Page 1055 and 1056:
1 0 0 2 In d ex Spa-Sta S p a n is
- Page 1057 and 1058:
1004 Index Sun-Tin P a g e P a g e
- Page 1059 and 1060:
1 0 0 6 Index Tra-Vet P a g e T ra
- Page 1061:
10G8 Index W ho-Zoo Wholesale trade