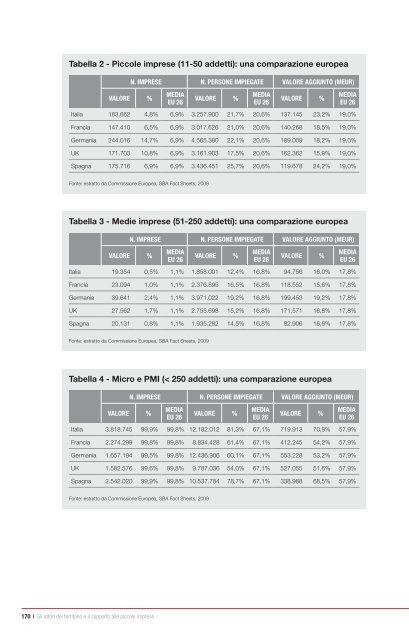
Tabella 2 - Picco<strong>le</strong> <strong>imprese</strong> (11-50 addetti): una comparazione europea 170 I Gli attori del territorio e <strong>il</strong> supporto al<strong>le</strong> <strong>picco<strong>le</strong></strong> <strong>imprese</strong> N. Imprese N. persoNe ImpIegate Valore aggIuNto (meur) Valore % medIa eu 26 Valore % medIa eu 26 Valore % medIa eu 26 Italia 183.662 4,8% 6,9% 3.257.900 21,7% 20,6% 137.145 23,2% 19,0% Francia 147.410 6,5% 6,9% 3.017.626 21,0% 20,6% 140.268 18,5% 19,0% Germania 244.016 14,7% 6,9% 4.565.380 22,1% 20,6% 189.009 18,2% 19,0% Uk 171.703 10,8% 6,9% 3.161.903 17,5% 20,6% 162.362 15,9% 19,0% Spagna 175.716 6,9% 6,9% 3.436.451 25,7% 20,6% 119.678 24,2% 19,0% Fonte: estratto da Commissione Europea, SBA Fact Sheets, 2009 Tabella 3 - Medie <strong>imprese</strong> (51-250 addetti): una comparazione europea N. Imprese N. persoNe ImpIegate Valore aggIuNto (meur) Valore % medIa eu 26 Valore % medIa eu 26 Valore % medIa eu 26 Italia 19.354 0,5% 1,1% 1.858.001 12,4% 16,8% 94.756 16,0% 17,8% Francia 23.094 1,0% 1,1% 2.376.895 16,5% 16,8% 118.552 15,6% 17,8% Germania 39.641 2,4% 1,1% 3.971.022 19,2% 16,8% 199.453 19,2% 17,8% Uk 27.562 1,7% 1,1% 2.755.698 15,2% 16,8% 171.571 16,8% 17,8% Spagna 20.131 0,8% 1,1% 1.935.282 14,5% 16,8% 82.906 16,8% 17,8% Fonte: estratto da Commissione Europea, SBA Fact Sheets, 2009 Tabella 4 - Micro e PMI (< 250 addetti): una comparazione europea N. Imprese N. persoNe ImpIegate Valore aggIuNto (meur) Valore % medIa eu 26 Valore % medIa eu 26 Valore % medIa eu 26 Italia 3.818.745 99,9% 99,8% 12.182.012 81,3% 67,1% 719.913 70,9% 57,9% Francia 2.274.299 99,8% 99,8% 8.834.428 61,4% 67,1% 412.245 54,2% 57,9% Germania 1.657.194 99,5% 99,8% 12.436.906 60,1% 67,1% 553.228 53,2% 57,9% Uk 1.582.576 99,6% 99,8% 9.787.036 54,0% 67,1% 527.055 51,6% 57,9% Spagna 2.542.020 99,9% 99,8% 10.537.784 78,7% 67,1% 338.988 68,5% 57,9% Fonte: estratto da Commissione Europea, SBA Fact Sheets, 2009
Tabella 5 - Grandi <strong>imprese</strong> (> 250 addetti): una comparazione europea N. Imprese N. persoNe ImpIegate Valore aggIuNto (meur) Valore % medIa eu 26 Valore % medIa eu 26 Valore % medIa eu 26 Italia 2.943 0,1% 0,2% 2.804.688 18,7% 32,9% 172.234 29,1% 42,1% Francia 5.000 0,2% 0,2% 5.553.907 38,6% 32,9% 347.744 45,8% 42,1% Germania 8.135 0,5% 0,2% 8.235.305 39,8% 32,9% 486.118 46,8% 42,1% Uk 6.240 0,4% 0,2% 8.323.762 46,0% 32,9% 494.351 48,4% 42,1% Spagna 3.032 0,1% 0,2% 2.849.049 21,3% 32,9% 155.619 31,5% 42,1% Fonte: estratto da Commissione Europea, SBA Fact Sheets, 2009 Come si può vedere dal<strong>le</strong> tabel<strong>le</strong> sopra riportate, l’Italia - rispetto ai suoi principali partner comunitari (oltre naturalmente alla media UE-26) - presenta una netta preva<strong>le</strong>nza di micro<strong>imprese</strong>, e ciò emerge considerando tutti e tre i parametri ut<strong>il</strong>izzati. Il 94,6% del<strong>le</strong> <strong>imprese</strong> sono micro (contro solo l’82% in Germania); esse danno lavoro al 47,1% degli occupati (<strong>il</strong> 18,9% in Germania) e generano <strong>il</strong> 31,8% del valore aggiunto (<strong>il</strong> 15,9% in Germania). D’altro canto, l’Italia è sottorappresentata, rispetto agli altri Paesi, nel<strong>le</strong> altre classi dimensionali di impresa; soprattutto, essa si caratterizza per una scarsa presenza, in termini relativi, di <strong>imprese</strong> medie o, vo<strong>le</strong>ndo, medio-<strong>picco<strong>le</strong></strong>. Nel comp<strong>le</strong>sso, tuttavia, considerando nel loro insieme <strong>le</strong> tre classi di <strong>imprese</strong> censite a livello europeo (Micro, Picco<strong>le</strong> e Medie, d’ora in avanti SME), la performance del sistema produttivo italiano appare assai significativa. Basti infatti pensare che - come pone in evidenza la Commissione Europea nel suo SBA Fact Sheet riferito all’Italia - vi sono all’incirca 65 SME per 1.000 abitanti, cifra che «è sostanzialmente al di sopra della media UE pari a circa 40». L’incidenza, sempre per 1.000 abitanti, è di 36 SME in Francia, 20 in Germania, 26 nel Regno Unito e 58 in Spagna. Per approfondire questa comparazione, facciamo riferimento alla Tabella 4. In tutti i Paesi della UE queste tre classi di <strong>imprese</strong> rappresentano oltre <strong>il</strong> 99,5% del tota<strong>le</strong>; in Italia addirittura <strong>il</strong> 99,9%. Dove <strong>le</strong> cose iniziano a differenziarsi è l’incidenza di queste (numerosissime) <strong>imprese</strong> sugli occupati e sul valore aggiunto prodotto. Qui emerge con nettezza <strong>il</strong> prof<strong>il</strong>o dell’Italia come Paese della «micro e piccola impresa» per antonomasia: l’81,3% nel caso degli occupati e <strong>il</strong> 70,9% per <strong>il</strong> valore aggiunto sono valori ampiamente superiori alla media UE-26 (rispettivamente, <strong>il</strong> 67,1% e <strong>il</strong> 57,9%), ma anche superiori ai valori realizzati dagli altri tre grandi, Germania, Francia e Regno Unito (che si muovono fra <strong>il</strong> 50 e <strong>il</strong> 60%), mentre più sim<strong>il</strong>i ai nostri sono i valori della Spagna. Se, come abbiamo richiamato in apertura, l’Italia ha la seconda manifattura d’Europa e se <strong>il</strong> cuore manifatturiero dell’Europa sta dentro un «c<strong>il</strong>indro» che va da Amburgo a Firenze, la traiettoria di sv<strong>il</strong>uppo della nostra industria non può che iscriversi in un orizzonte autenticamente europeo. L’UE, se la confrontiamo dal punto di vista struttura<strong>le</strong> con <strong>le</strong> altre due maggiori aree economiche del mondo, presenta ancora oggi una base industria<strong>le</strong> (26,5% del valore aggiunto) che la rende più simi<strong>le</strong> al Giappone (28,5%) che non agli Stati Uniti (21,8%) 6 . 6 Il confronto fra i tre Paesi della «Triade» si trova in: European Central Bank, Statistic Pocket Book, September 2009: i dati sulla ripartizione del valore aggiunto per attività economica si riferiscono al 2008 per l’UE e al 2007 per USA e Giappone; quelli sull’industria si intendono comprensivi del<strong>le</strong> costruzioni. Va altresì segnalato, fra gli altri, <strong>il</strong> dato sul P<strong>il</strong> (in Ppa): l’UE-27 è la prima potenza economica del mondo (13,0 tr<strong>il</strong>ioni di Euro contro i 12,3 degli USA e i 3,7 del Giappone), ma soprattutto rispetto agli USA sconta un gap nel P<strong>il</strong> pro-capite, sempre in Ppa (26.100 Euro, che salgono a 28.300 nell’Area Euro, contro i 40.300 degli Usa e i 29.000 del Giappone). La diversa dinamica della produttività è offerta come principa<strong>le</strong> spiegazione di questa differenza: posta pari a 100 la produttività del lavoro (in Ppa) nell’Area Euro, <strong>il</strong> valore scende a 91,7 nell’UE (e lo stesso accade per <strong>il</strong> Giappone) mentre sa<strong>le</strong> a 132,5 negli Usa. Capitolo 6 I 171
- Page 1:
RappoRto UniCRedit sUlle piCCole im
- Page 4 and 5:
nato nel 2004, l’osservatorio Uni
- Page 6 and 7:
pResentazione È con grande piacere
- Page 8 and 9:
Indice 6 I Rapporto UniCredit sulle
- Page 10 and 11:
8 I Sintesi dei principali risultat
- Page 12 and 13:
sintesi dei pRincipali Risultati ca
- Page 14 and 15:
oggi però tutto questo non basta.
- Page 16 and 17:
discorso leggermente diverso per qu
- Page 18 and 19:
16 I Quale scenario per la piccola
- Page 20 and 21:
Quale scenario per la piccola impre
- Page 22 and 23:
Figura 1 - Indicatore di attività
- Page 24 and 25:
Figura 5 - Le immatricolazioni di a
- Page 26 and 27:
a livello dimensionale, soprattutto
- Page 28 and 29:
Figura 9 - Tassi di decadimento per
- Page 30 and 31:
Figura 12 - Accesso al credito e fo
- Page 32 and 33:
30 I La parola ai piccoli imprendit
- Page 34 and 35:
LA PAROLA AI PICCOLI IMPRENDITORI:
- Page 36 and 37:
Tabella 3 - Distribuzione delle imp
- Page 38 and 39:
Per quanto riguarda la disponibilit
- Page 40 and 41:
1) Propensione agli investimenti An
- Page 42 and 43:
4) Tempi di incasso Il valore della
- Page 44 and 45:
7) Situazione economica generale L
- Page 46 and 47:
Figura 4 - Indice di fi ducia per c
- Page 48 and 49:
Figura 6 - Indice di fi ducia delle
- Page 50 and 51:
Anche rispetto alle aspettative, l
- Page 52 and 53:
Anche questa disamina appena illust
- Page 54 and 55:
2.2.10 ANALIsI TRA CLIENTI uNICREDI
- Page 56 and 57:
Figura 11 - Come valuta l’iter pr
- Page 58 and 59:
2.4 APPENDICE Indice di fiducia sin
- Page 60 and 61:
Ascoli Piceno Fonte: Indagine UniCr
- Page 62 and 63:
Campobasso Fonte: Indagine UniCredi
- Page 64 and 65:
Frosinone Fonte: Indagine UniCredit
- Page 66 and 67:
Mantova Fonte: Indagine UniCredit M
- Page 68 and 69:
Pesaro - Urbino Fonte: Indagine Uni
- Page 70 and 71:
Roma Fonte: Indagine UniCredit Sale
- Page 72 and 73:
Udine - Gorizia Fonte: Indagine Uni
- Page 74 and 75:
72 I Riannodare i fili della fiduci
- Page 76 and 77:
RiannodaRe i fili della fiducia: la
- Page 78 and 79:
logica d’interazione, l’intensi
- Page 80 and 81:
“freddi numeri da foglio excel”
- Page 82 and 83:
fattore esogeno alle scelte operati
- Page 84 and 85:
Noi aspettiamo una seconda ondata d
- Page 86 and 87:
La prima tendenza che pare importan
- Page 88 and 89:
nel corso degli ultimi anni hanno c
- Page 90 and 91:
Per riuscire a trasformare il catac
- Page 92 and 93:
Nella crisi, quindi, il sistema dei
- Page 94 and 95:
fondamentali di questo progetto. Do
- Page 96 and 97:
94 I La crisi finanziaria e le cons
- Page 98 and 99:
La crisi finanziaria e Le conseguen
- Page 100 and 101:
Una volta aumentata la liquidità p
- Page 102 and 103:
Inoltre, le banche commerciali si f
- Page 104 and 105:
Figura 3 - Debiti bancari totali in
- Page 106 and 107:
Oltre al calo della componente di d
- Page 108 and 109:
4.3 uno sguardo suLLe piccoLe impre
- Page 110 and 111:
Figura 10 - Tensione fi nanziaria p
- Page 112 and 113:
Il rapporto di utilizzo del credito
- Page 114 and 115:
Su questi aspetti, una recente inda
- Page 116 and 117:
114 I La reazione alla crisi: i com
- Page 118 and 119:
La reazione aLLa crisi: i comportam
- Page 120 and 121:
il 34,5%, quota che nel 2009 si att
- Page 122 and 123: Tabella 1 - Reazione al peggioramen
- Page 124 and 125: Nel complesso, dalle risposte emerg
- Page 126 and 127: di seguito (sezione 6.2.2), costitu
- Page 128 and 129: Tabella 8 - Domanda e offerta nella
- Page 130 and 131: cambiamento (Tabella 11) figurano i
- Page 132 and 133: Tabella 13 - Collocazione fornitori
- Page 134 and 135: Tale aspetto è più marcato per i
- Page 136 and 137: Tabella 16 - Ostacoli che impedisco
- Page 138 and 139: Tabella 17 - Le reti costituite sul
- Page 140 and 141: Dalla Tabella 19 si rileva che la c
- Page 142 and 143: Figura 4 - Grado di apertura dell
- Page 144 and 145: La Tabella 23 mostra le principali
- Page 146 and 147: Tabella 25 - Servizi ritenuti utili
- Page 148 and 149: Continua Tabella 25 - Servizi riten
- Page 150 and 151: Continua Tabella 26 - Servizi banca
- Page 152 and 153: Continua Tabella 26 - Servizi banca
- Page 154 and 155: I risultati sin qui commentati sull
- Page 156 and 157: Nonostante questa consapevolezza di
- Page 158 and 159: Il commercio elettronico si rivela
- Page 160 and 161: Tabella 36 - Di che tipo di compete
- Page 162 and 163: Tabella 38 - Come contribuisce alla
- Page 164 and 165: I legami tra imprese sul territorio
- Page 166 and 167: 164 I Gli attori del territorio e i
- Page 168 and 169: Gli attori del territorio e il supp
- Page 170 and 171: È dall’Europa quindi che deve pa
- Page 174 and 175: Questa struttura economica può ess
- Page 176 and 177: La seconda serie di dati fa emerger
- Page 178 and 179: Il passo successivo consiste nel me
- Page 180 and 181: Interessante diviene l'analisi dei
- Page 182 and 183: Figura 1 - Saldi commerciali region
- Page 184 and 185: La prima indagine è quella dell’
- Page 186 and 187: 6.1.4 la questione della produttivi
- Page 188 and 189: Eppure i positivi risultati consegu
- Page 190 and 191: scientifica e l’innovazione tecno
- Page 192 and 193: Per il complesso dei Paesi dell’U
- Page 194 and 195: Circoscriviamo l’analisi all’Eu
- Page 196 and 197: Tabella 18 - La performance turisti
- Page 198 and 199: Al di là del dato generale, la val
- Page 200 and 201: l’estero, e tra i fattori distint
- Page 202 and 203: pari rispettivamente a 126,4, 107,8
- Page 204 and 205: Nel caso dell’Italia questa strat
- Page 206 and 207: 6.3.1 l’impatto dell’aGricoltur
- Page 208 and 209: Quadro 1 aGricoltura e BioenerGie N
- Page 210 and 211: i beni alimentari, seppur con diver
- Page 212 and 213: e non spiega il ruolo che i nostri
- Page 214 and 215: assistito ad un’evoluzione nei ra
- Page 216 and 217: strumenti di protezione predisposti
- Page 218 and 219: in maniera autonoma rispetto all’
- Page 220 and 221: Tuttavia, meno consenso raccoglie l
- Page 222 and 223:
Tabella 35 - Secondo Lei, a chi tra
- Page 224 and 225:
Tabella 37 - Quali criticità rilev
- Page 226 and 227:
è nel territorio, in particolare g
- Page 228 and 229:
Chi non fa ricorso ai Confidi dichi
- Page 230 and 231:
capaci di migliorare il processo di
- Page 232 and 233:
Tabella 49 - Problemi connessi al l
- Page 234 and 235:
Quelle appena illustrate sono prefe
- Page 236 and 237:
Quadro 2 il proGetto impresa italia
- Page 238 and 239:
conclusioni I fattori di competitiv