Rapporto Unicredit sulle piccole imprese le piccole imprese e il
Rapporto Unicredit sulle piccole imprese le piccole imprese e il
Rapporto Unicredit sulle piccole imprese le piccole imprese e il

You also want an ePaper? Increase the reach of your titles
YUMPU automatically turns print PDFs into web optimized ePapers that Google loves.
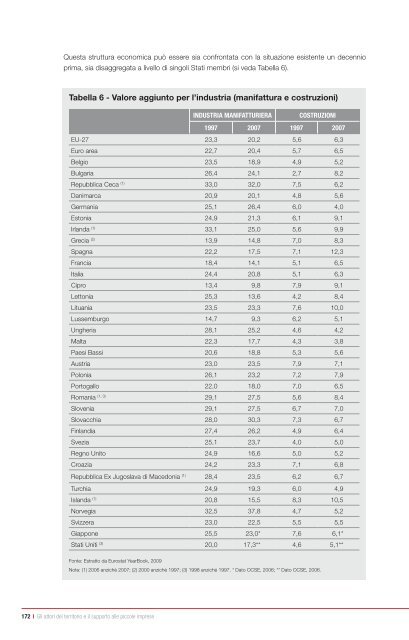
Questa struttura economica può essere sia confrontata con la situazione esistente un decennio<br />
prima, sia disaggregata a livello di singoli Stati membri (si veda Tabella 6).<br />
Tabella 6 - Valore aggiunto per l’industria (manifattura e costruzioni)<br />
172 I Gli attori del territorio e <strong>il</strong> supporto al<strong>le</strong> <strong>picco<strong>le</strong></strong> <strong>imprese</strong><br />
INdustrIa maNIfatturIera CostruzIoNI<br />
1997 2007 1997 2007<br />
EU-27 23,3 20,2 5,6 6,3<br />
Euro area 22,7 20,4 5,7 6,5<br />
Belgio 23,5 18,9 4,9 5,2<br />
Bulgaria 26,4 24,1 2,7 8,2<br />
Repubblica Ceca (1) 33,0 32,0 7,5 6,2<br />
Danimarca 20,9 20,1 4,8 5,6<br />
Germania 25,1 26,4 6,0 4,0<br />
Estonia 24,9 21,3 6,1 9,1<br />
Irlanda (1) 33,1 25,0 5,6 9,9<br />
Grecia (2) 13,9 14,8 7,0 8,3<br />
Spagna 22,2 17,5 7,1 12,3<br />
Francia 18,4 14,1 5,1 6,5<br />
Italia 24,4 20,8 5,1 6,3<br />
Cipro 13,4 9,8 7,9 9,1<br />
Lettonia 25,3 13,6 4,2 8,4<br />
Lituania 23,5 23,3 7,6 10,0<br />
Lussemburgo 14,7 9,3 6,2 5,1<br />
Ungheria 28,1 25,2 4,6 4,2<br />
Malta 22,3 17,7 4,3 3,8<br />
Paesi Bassi 20,6 18,8 5,3 5,6<br />
Austria 23,0 23,5 7,9 7,1<br />
Polonia 26,1 23,2 7,2 7,9<br />
Portogallo 22,0 18,0 7,0 6,5<br />
Romania (1, 3) 29,1 27,5 5,6 8,4<br />
Slovenia 29,1 27,5 6,7 7,0<br />
Slovacchia 28,0 30,3 7,3 6,7<br />
Finlandia 27,4 26,2 4,9 6,4<br />
Svezia 25,1 23,7 4,0 5,0<br />
Regno Unito 24,9 16,6 5,0 5,2<br />
Croazia 24,2 23,3 7,1 6,8<br />
Repubblica Ex Jugoslava di Macedonia (1) 28,4 23,5 6,2 6,7<br />
Turchia 24,9 19,3 6,0 4,9<br />
Islanda (1) 20,8 15,5 8,3 10,5<br />
Norvegia 32,5 37,8 4,7 5,2<br />
Svizzera 23,0 22,5 5,5 5,5<br />
Giappone 25,5 23,0* 7,6 6,1*<br />
Stati Uniti (3) 20,0 17,3** 4,6 5,1**<br />
Fonte: Estratto da Eurostat YearBook, 2009<br />
Note: (1) 2006 anziché 2007; (2) 2000 anziché 1997; (3) 1998 anziché 1997. * Dato OCSE, 2006; ** Dato OCSE, 2006.