

book1
book1
book1

You also want an ePaper? Increase the reach of your titles
YUMPU automatically turns print PDFs into web optimized ePapers that Google loves.
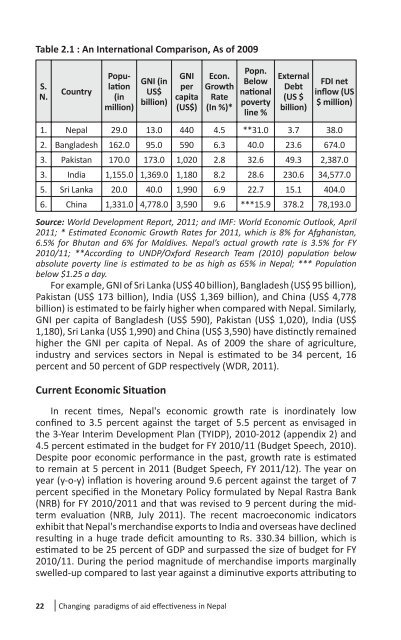
Table 2.1 : An Interna� onal Comparison, As of 2009<br />
S.<br />
N.<br />
22<br />
Country<br />
Popula�<br />
on<br />
(in<br />
million)<br />
GNI (in<br />
US$<br />
billion)<br />
GNI<br />
per<br />
capita<br />
(US$)<br />
Econ.<br />
Growth<br />
Rate<br />
(In %)*<br />
Changing paradigms of aid eff ec� veness in Nepal<br />
Popn.<br />
Below<br />
na� onal<br />
poverty<br />
line %<br />
External<br />
Debt<br />
(US $<br />
billion)<br />
FDI net<br />
infl ow (US<br />
$ million)<br />
1. Nepal 29.0 13.0 440 4.5 **31.0 3.7 38.0<br />
2. Bangladesh 162.0 95.0 590 6.3 40.0 23.6 674.0<br />
3. Pakistan 170.0 173.0 1,020 2.8 32.6 49.3 2,387.0<br />
3. India 1,155.0 1,369.0 1,180 8.2 28.6 230.6 34,577.0<br />
5. Sri Lanka 20.0 40.0 1,990 6.9 22.7 15.1 404.0<br />
6. China 1,331.0 4,778.0 3,590 9.6 ***15.9 378.2 78,193.0<br />
Source: World Development Report, 2011; and IMF: World Economic Outlook, April<br />
2011; * Es� mated Economic Growth Rates for 2011, which is 8% for Afghanistan,<br />
6.5% for Bhutan and 6% for Maldives. Nepal’s actual growth rate is 3.5% for FY<br />
2010/11; **According to UNDP/Oxford Research Team (2010) popula� on below<br />
absolute poverty line is es� mated to be as high as 65% in Nepal; *** Popula� on<br />
below $1.25 a day.<br />
For example, GNI of Sri Lanka (US$ 40 billion), Bangladesh (US$ 95 billion),<br />
Pakistan (US$ 173 billion), India (US$ 1,369 billion), and China (US$ 4,778<br />
billion) is es� mated to be fairly higher when compared with Nepal. Similarly,<br />
GNI per capita of Bangladesh (US$ 590), Pakistan (US$ 1,020), India (US$<br />
1,180), Sri Lanka (US$ 1,990) and China (US$ 3,590) have dis� nctly remained<br />
higher the GNI per capita of Nepal. As of 2009 the share of agriculture,<br />
industry and services sectors in Nepal is es� mated to be 34 percent, 16<br />
percent and 50 percent of GDP respec� vely (WDR, 2011).<br />
Current Economic Situa� on<br />
In recent � mes, Nepal's economic growth rate is inordinately low<br />
confi ned to 3.5 percent against the target of 5.5 percent as envisaged in<br />
the 3-Year Interim Development Plan (TYIDP), 2010-2012 (appendix 2) and<br />
4.5 percent es� mated in the budget for FY 2010/11 (Budget Speech, 2010).<br />
Despite poor economic performance in the past, growth rate is es� mated<br />
to remain at 5 percent in 2011 (Budget Speech, FY 2011/12). The year on<br />
year (y-o-y) infl a� on is hovering around 9.6 percent against the target of 7<br />
percent specifi ed in the Monetary Policy formulated by Nepal Rastra Bank<br />
(NRB) for FY 2010/2011 and that was revised to 9 percent during the midterm<br />
evalua� on (NRB, July 2011). The recent macroeconomic indicators<br />
exhibit that Nepal's merchandise exports to India and overseas have declined<br />
resul� ng in a huge trade defi cit amoun� ng to Rs. 330.34 billion, which is<br />
es� mated to be 25 percent of GDP and surpassed the size of budget for FY<br />
2010/11. During the period magnitude of merchandise imports marginally<br />
swelled-up compared to last year against a diminu� ve exports a� ribu� ng to