

book1
book1
book1

Create successful ePaper yourself
Turn your PDF publications into a flip-book with our unique Google optimized e-Paper software.
is rela� vely higher in Nepal as compared to other member countries in the<br />
SAARC region.<br />
Nepal’s tax system lacks simplicity, transparency and compe� � veness,<br />
which is detrimental to a� ract FDI and mobilize indigenous investments.<br />
Since elas� city of taxa� on is found to be below the unity (0.9), there is<br />
tremendous scope for tax reforms in Nepal (Dahal, 2009) especially to design<br />
a compe� � ve tax structure through se� ng-up of Central Revenue Board, a<br />
semi-autonomous body at Ministry of Finance, Government of Nepal (MOF,<br />
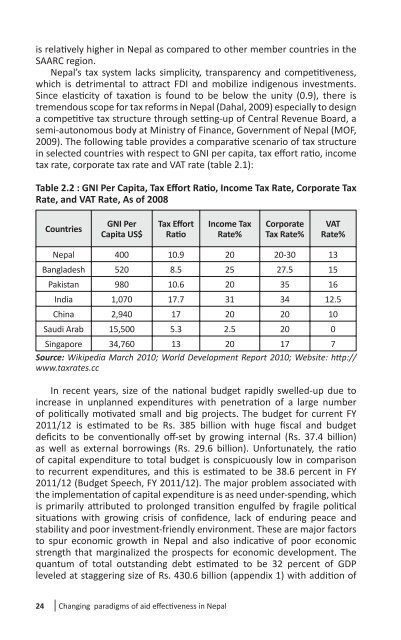
2009). The following table provides a compara� ve scenario of tax structure<br />
in selected countries with respect to GNI per capita, tax eff ort ra� o, income<br />
tax rate, corporate tax rate and VAT rate (table 2.1):<br />
Table 2.2 : GNI Per Capita, Tax Eff ort Ra� o, Income Tax Rate, Corporate Tax<br />
Rate, and VAT Rate, As of 2008<br />
24<br />
Countries<br />
GNI Per<br />
Capita US$<br />
Tax Eff ort<br />
Ra� o<br />
Changing paradigms of aid eff ec� veness in Nepal<br />
Income Tax<br />
Rate%<br />
Corporate<br />
Tax Rate%<br />
VAT<br />
Rate%<br />
Nepal 400 10.9 20 20-30 13<br />
Bangladesh 520 8.5 25 27.5 15<br />
Pakistan 980 10.6 20 35 16<br />
India 1,070 17.7 31 34 12.5<br />
China 2,940 17 20 20 10<br />
Saudi Arab 15,500 5.3 2.5 20 0<br />
Singapore 34,760 13 20 17 7<br />
Source: Wikipedia March 2010; World Development Report 2010; Website: h� p://<br />
www.taxrates.cc<br />
In recent years, size of the na� onal budget rapidly swelled-up due to<br />
increase in unplanned expenditures with penetra� on of a large number<br />
of poli� cally mo� vated small and big projects. The budget for current FY<br />
2011/12 is es� mated to be Rs. 385 billion with huge fi scal and budget<br />
defi cits to be conven� onally off -set by growing internal (Rs. 37.4 billion)<br />
as well as external borrowings (Rs. 29.6 billion). Unfortunately, the ra� o<br />
of capital expenditure to total budget is conspicuously low in comparison<br />
to recurrent expenditures, and this is es� mated to be 38.6 percent in FY<br />
2011/12 (Budget Speech, FY 2011/12). The major problem associated with<br />
the implementa� on of capital expenditure is as need under-spending, which<br />
is primarily a� ributed to prolonged transi� on engulfed by fragile poli� cal<br />
situa� ons with growing crisis of confi dence, lack of enduring peace and<br />
stability and poor investment-friendly environment. These are major factors<br />
to spur economic growth in Nepal and also indica� ve of poor economic<br />
strength that marginalized the prospects for economic development. The<br />
quantum of total outstanding debt es� mated to be 32 percent of GDP<br />
leveled at staggering size of Rs. 430.6 billion (appendix 1) with addi� on of