

book1
book1
book1

You also want an ePaper? Increase the reach of your titles
YUMPU automatically turns print PDFs into web optimized ePapers that Google loves.
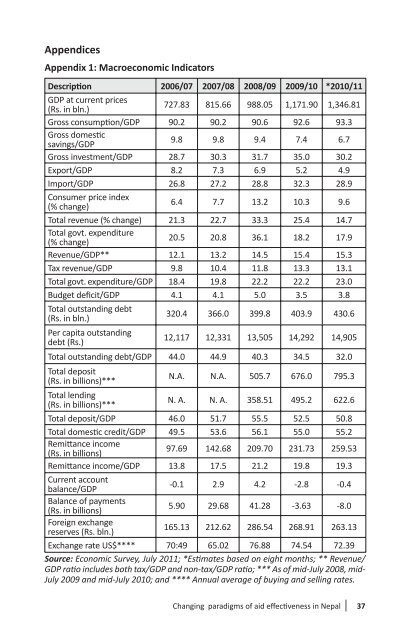
Appendices<br />
Appendix 1: Macroeconomic Indicators<br />
Descrip� on 2006/07 2007/08 2008/09 2009/10 *2010/11<br />
GDP at current prices<br />
(Rs. in bln.)<br />
727.83 815.66 988.05 1,171.90 1,346.81<br />
Gross consump� on/GDP 90.2 90.2 90.6 92.6 93.3<br />
Gross domes� c<br />
savings/GDP<br />
9.8 9.8 9.4 7.4 6.7<br />
Gross investment/GDP 28.7 30.3 31.7 35.0 30.2<br />
Export/GDP 8.2 7.3 6.9 5.2 4.9<br />
Import/GDP 26.8 27.2 28.8 32.3 28.9<br />
Consumer price index<br />
(% change)<br />
6.4 7.7 13.2 10.3 9.6<br />
Total revenue (% change) 21.3 22.7 33.3 25.4 14.7<br />
Total govt. expenditure<br />
(% change)<br />
20.5 20.8 36.1 18.2 17.9<br />
Revenue/GDP** 12.1 13.2 14.5 15.4 15.3<br />
Tax revenue/GDP 9.8 10.4 11.8 13.3 13.1<br />
Total govt. expenditure/GDP 18.4 19.8 22.2 22.2 23.0<br />
Budget defi cit/GDP 4.1 4.1 5.0 3.5 3.8<br />
Total outstanding debt<br />
(Rs. in bln.)<br />
320.4 366.0 399.8 403.9 430.6<br />
Per capita outstanding<br />
debt (Rs.)<br />
12,117 12,331 13,505 14,292 14,905<br />
Total outstanding debt/GDP 44.0 44.9 40.3 34.5 32.0<br />
Total deposit<br />
(Rs. in billions)***<br />
N.A. N.A. 505.7 676.0 795.3<br />
Total lending<br />
(Rs. in billions)***<br />
N. A. N. A. 358.51 495.2 622.6<br />
Total deposit/GDP 46.0 51.7 55.5 52.5 50.8<br />
Total domes� c credit/GDP 49.5 53.6 56.1 55.0 55.2<br />
Remi� ance income<br />
(Rs. in billions)<br />
97.69 142.68 209.70 231.73 259.53<br />
Remi� ance income/GDP 13.8 17.5 21.2 19.8 19.3<br />
Current account<br />
balance/GDP<br />
-0.1 2.9 4.2 -2.8 -0.4<br />
Balance of payments<br />
(Rs. in billions)<br />
5.90 29.68 41.28 -3.63 -8.0<br />
Foreign exchange<br />
reserves (Rs. bln.)<br />
165.13 212.62 286.54 268.91 263.13<br />
Exchange rate US$**** 70:49 65.02 76.88 74.54 72.39<br />
Source: Economic Survey, July 2011; *Es� mates based on eight months; ** Revenue/<br />
GDP ra� o includes both tax/GDP and non-tax/GDP ra� o; *** As of mid-July 2008, mid-<br />
July 2009 and mid-July 2010; and **** Annual average of buying and selling rates.<br />
Changing paradigms of aid eff ec� veness in Nepal 37